Immigrants from Bangladesh vs Ottawa Female Disability
COMPARE
Immigrants from Bangladesh
Ottawa
Female Disability
Female Disability Comparison
Immigrants from Bangladesh
Ottawa
11.8%
FEMALE DISABILITY
97.8/ 100
METRIC RATING
112th/ 347
METRIC RANK
14.2%
FEMALE DISABILITY
0.0/ 100
METRIC RATING
327th/ 347
METRIC RANK
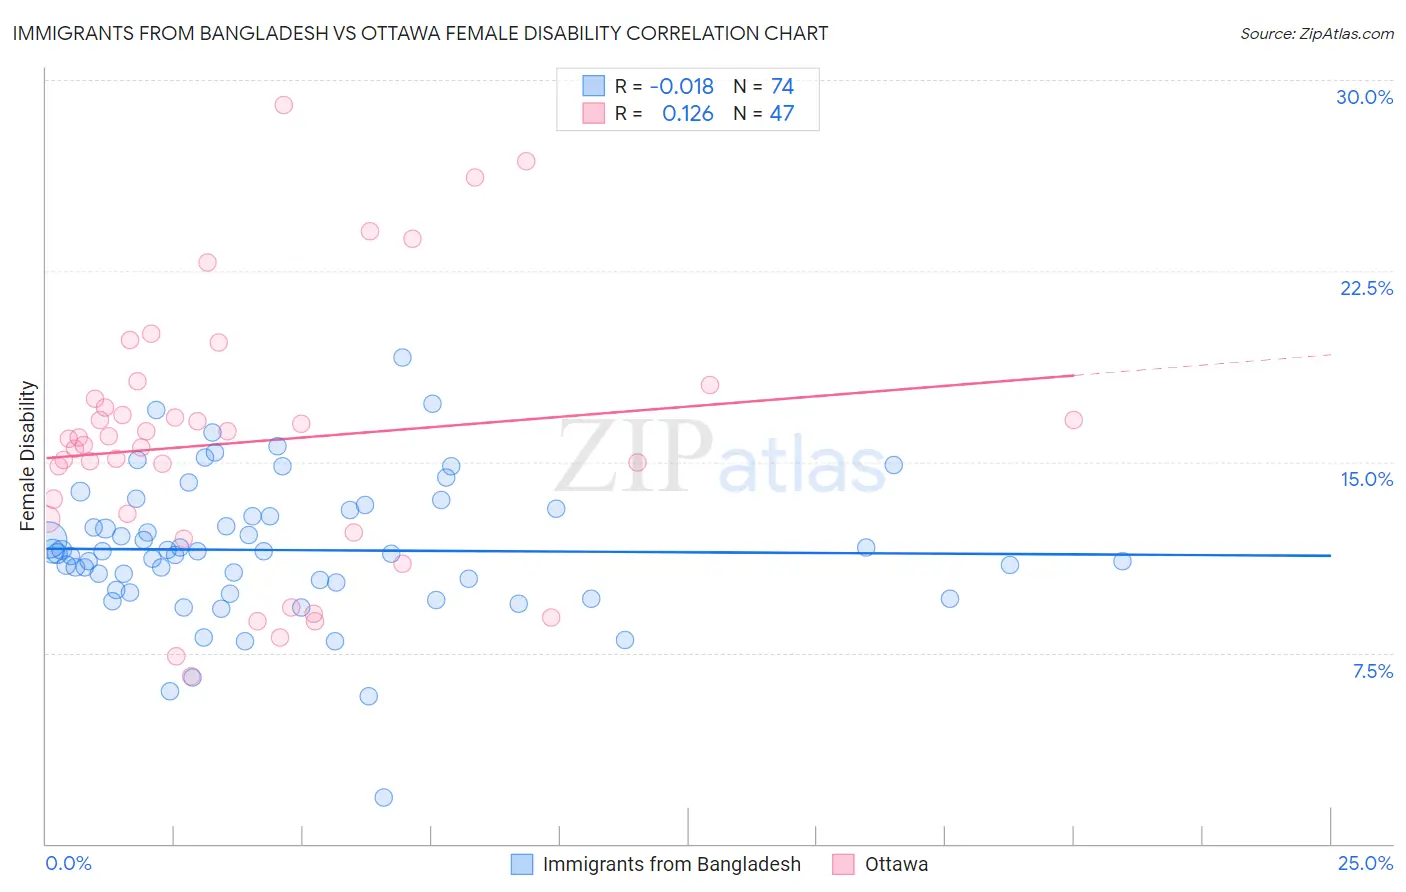
Immigrants from Bangladesh vs Ottawa Female Disability Correlation Chart
The statistical analysis conducted on geographies consisting of 203,667,560 people shows no correlation between the proportion of Immigrants from Bangladesh and percentage of females with a disability in the United States with a correlation coefficient (R) of -0.018 and weighted average of 11.8%. Similarly, the statistical analysis conducted on geographies consisting of 49,954,639 people shows a poor positive correlation between the proportion of Ottawa and percentage of females with a disability in the United States with a correlation coefficient (R) of 0.126 and weighted average of 14.2%, a difference of 21.1%.
Female Disability Correlation Summary
| Measurement | Immigrants from Bangladesh | Ottawa |
| Minimum | 1.8% | 6.6% |
| Maximum | 19.1% | 29.0% |
| Range | 17.3% | 22.4% |
| Mean | 11.5% | 15.8% |
| Median | 11.4% | 15.9% |
| Interquartile 25% (IQ1) | 10.0% | 12.8% |
| Interquartile 75% (IQ3) | 13.1% | 17.5% |
| Interquartile Range (IQR) | 3.2% | 4.7% |
| Standard Deviation (Sample) | 2.8% | 5.1% |
| Standard Deviation (Population) | 2.8% | 5.0% |
Similar Demographics by Female Disability
Demographics Similar to Immigrants from Bangladesh by Female Disability
In terms of female disability, the demographic groups most similar to Immigrants from Bangladesh are Immigrants from Belarus (11.8%, a difference of 0.010%), South African (11.8%, a difference of 0.040%), Brazilian (11.8%, a difference of 0.040%), Immigrants from Morocco (11.8%, a difference of 0.090%), and Costa Rican (11.7%, a difference of 0.12%).
| Demographics | Rating | Rank | Female Disability |
| Australians | 98.3 /100 | #105 | Exceptional 11.7% |
| Immigrants | Greece | 98.2 /100 | #106 | Exceptional 11.7% |
| Latvians | 98.2 /100 | #107 | Exceptional 11.7% |
| New Zealanders | 98.1 /100 | #108 | Exceptional 11.7% |
| Immigrants | Immigrants | 98.1 /100 | #109 | Exceptional 11.7% |
| Soviet Union | 98.1 /100 | #110 | Exceptional 11.7% |
| Costa Ricans | 98.1 /100 | #111 | Exceptional 11.7% |
| Immigrants | Bangladesh | 97.8 /100 | #112 | Exceptional 11.8% |
| Immigrants | Belarus | 97.8 /100 | #113 | Exceptional 11.8% |
| South Africans | 97.7 /100 | #114 | Exceptional 11.8% |
| Brazilians | 97.7 /100 | #115 | Exceptional 11.8% |
| Immigrants | Morocco | 97.6 /100 | #116 | Exceptional 11.8% |
| Immigrants | Eastern Europe | 97.2 /100 | #117 | Exceptional 11.8% |
| Immigrants | Nigeria | 97.2 /100 | #118 | Exceptional 11.8% |
| Immigrants | Uganda | 97.2 /100 | #119 | Exceptional 11.8% |
Demographics Similar to Ottawa by Female Disability
In terms of female disability, the demographic groups most similar to Ottawa are Cape Verdean (14.2%, a difference of 0.0%), Osage (14.3%, a difference of 0.43%), Comanche (14.2%, a difference of 0.44%), Navajo (14.2%, a difference of 0.55%), and Native/Alaskan (14.1%, a difference of 0.69%).
| Demographics | Rating | Rank | Female Disability |
| Americans | 0.0 /100 | #320 | Tragic 14.1% |
| Potawatomi | 0.0 /100 | #321 | Tragic 14.1% |
| Pueblo | 0.0 /100 | #322 | Tragic 14.1% |
| Blacks/African Americans | 0.0 /100 | #323 | Tragic 14.1% |
| Natives/Alaskans | 0.0 /100 | #324 | Tragic 14.1% |
| Navajo | 0.0 /100 | #325 | Tragic 14.2% |
| Comanche | 0.0 /100 | #326 | Tragic 14.2% |
| Ottawa | 0.0 /100 | #327 | Tragic 14.2% |
| Cape Verdeans | 0.0 /100 | #328 | Tragic 14.2% |
| Osage | 0.0 /100 | #329 | Tragic 14.3% |
| Yuman | 0.0 /100 | #330 | Tragic 14.5% |
| Immigrants | Cabo Verde | 0.0 /100 | #331 | Tragic 14.6% |
| Pima | 0.0 /100 | #332 | Tragic 14.8% |
| Immigrants | Azores | 0.0 /100 | #333 | Tragic 14.9% |
| Cherokee | 0.0 /100 | #334 | Tragic 14.9% |