Menominee vs Shoshone Median Earnings
COMPARE
Menominee
Shoshone
Median Earnings
Median Earnings Comparison
Menominee
Shoshone
$37,884
MEDIAN EARNINGS
0.0/ 100
METRIC RATING
339th/ 347
METRIC RANK
$40,932
MEDIAN EARNINGS
0.0/ 100
METRIC RATING
302nd/ 347
METRIC RANK
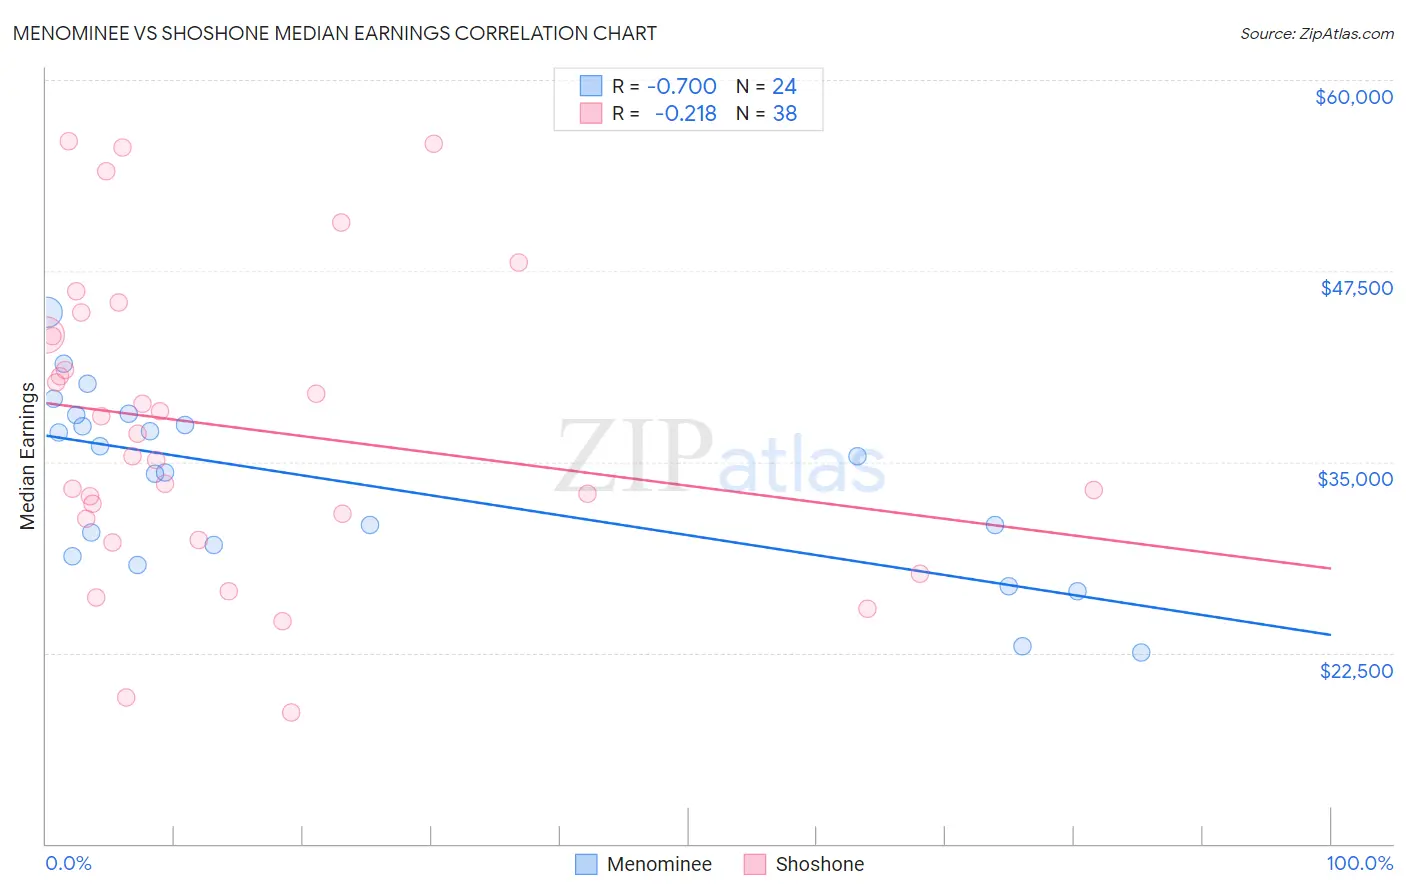
Menominee vs Shoshone Median Earnings Correlation Chart
The statistical analysis conducted on geographies consisting of 45,778,612 people shows a strong negative correlation between the proportion of Menominee and median earnings in the United States with a correlation coefficient (R) of -0.700 and weighted average of $37,884. Similarly, the statistical analysis conducted on geographies consisting of 66,619,980 people shows a weak negative correlation between the proportion of Shoshone and median earnings in the United States with a correlation coefficient (R) of -0.218 and weighted average of $40,932, a difference of 8.1%.
Median Earnings Correlation Summary
| Measurement | Menominee | Shoshone |
| Minimum | $22,480 | $18,625 |
| Maximum | $44,793 | $56,007 |
| Range | $22,313 | $37,382 |
| Mean | $33,658 | $37,253 |
| Median | $34,813 | $36,104 |
| Interquartile 25% (IQ1) | $29,201 | $31,272 |
| Interquartile 75% (IQ3) | $37,722 | $43,286 |
| Interquartile Range (IQR) | $8,521 | $12,015 |
| Standard Deviation (Sample) | $5,845 | $9,755 |
| Standard Deviation (Population) | $5,722 | $9,625 |
Similar Demographics by Median Earnings
Demographics Similar to Menominee by Median Earnings
In terms of median earnings, the demographic groups most similar to Menominee are Pima ($38,285, a difference of 1.1%), Immigrants from Cuba ($38,426, a difference of 1.4%), Crow ($38,707, a difference of 2.2%), Navajo ($36,999, a difference of 2.4%), and Native/Alaskan ($38,896, a difference of 2.7%).
| Demographics | Rating | Rank | Median Earnings |
| Yakama | 0.0 /100 | #332 | Tragic $39,107 |
| Houma | 0.0 /100 | #333 | Tragic $38,949 |
| Spanish American Indians | 0.0 /100 | #334 | Tragic $38,907 |
| Natives/Alaskans | 0.0 /100 | #335 | Tragic $38,896 |
| Crow | 0.0 /100 | #336 | Tragic $38,707 |
| Immigrants | Cuba | 0.0 /100 | #337 | Tragic $38,426 |
| Pima | 0.0 /100 | #338 | Tragic $38,285 |
| Menominee | 0.0 /100 | #339 | Tragic $37,884 |
| Navajo | 0.0 /100 | #340 | Tragic $36,999 |
| Lumbee | 0.0 /100 | #341 | Tragic $36,876 |
| Hopi | 0.0 /100 | #342 | Tragic $36,871 |
| Pueblo | 0.0 /100 | #343 | Tragic $36,859 |
| Arapaho | 0.0 /100 | #344 | Tragic $36,586 |
| Tohono O'odham | 0.0 /100 | #345 | Tragic $36,349 |
| Yup'ik | 0.0 /100 | #346 | Tragic $35,942 |
Demographics Similar to Shoshone by Median Earnings
In terms of median earnings, the demographic groups most similar to Shoshone are Haitian ($40,918, a difference of 0.030%), Immigrants from Guatemala ($40,851, a difference of 0.20%), Ute ($41,051, a difference of 0.29%), Immigrants from Latin America ($41,049, a difference of 0.29%), and Immigrants from Caribbean ($41,119, a difference of 0.46%).
| Demographics | Rating | Rank | Median Earnings |
| Bangladeshis | 0.1 /100 | #295 | Tragic $41,263 |
| Cherokee | 0.1 /100 | #296 | Tragic $41,252 |
| Guatemalans | 0.1 /100 | #297 | Tragic $41,205 |
| Immigrants | Micronesia | 0.1 /100 | #298 | Tragic $41,133 |
| Immigrants | Caribbean | 0.1 /100 | #299 | Tragic $41,119 |
| Ute | 0.1 /100 | #300 | Tragic $41,051 |
| Immigrants | Latin America | 0.1 /100 | #301 | Tragic $41,049 |
| Shoshone | 0.0 /100 | #302 | Tragic $40,932 |
| Haitians | 0.0 /100 | #303 | Tragic $40,918 |
| Immigrants | Guatemala | 0.0 /100 | #304 | Tragic $40,851 |
| Chickasaw | 0.0 /100 | #305 | Tragic $40,672 |
| Yaqui | 0.0 /100 | #306 | Tragic $40,647 |
| Hondurans | 0.0 /100 | #307 | Tragic $40,638 |
| Cubans | 0.0 /100 | #308 | Tragic $40,619 |
| Immigrants | Haiti | 0.0 /100 | #309 | Tragic $40,550 |