Menominee vs Luxembourger Hearing Disability
COMPARE
Menominee
Luxembourger
Hearing Disability
Hearing Disability Comparison
Menominee
Luxembourgers
3.7%
HEARING DISABILITY
0.0/ 100
METRIC RATING
303rd/ 347
METRIC RANK
3.2%
HEARING DISABILITY
2.9/ 100
METRIC RATING
231st/ 347
METRIC RANK
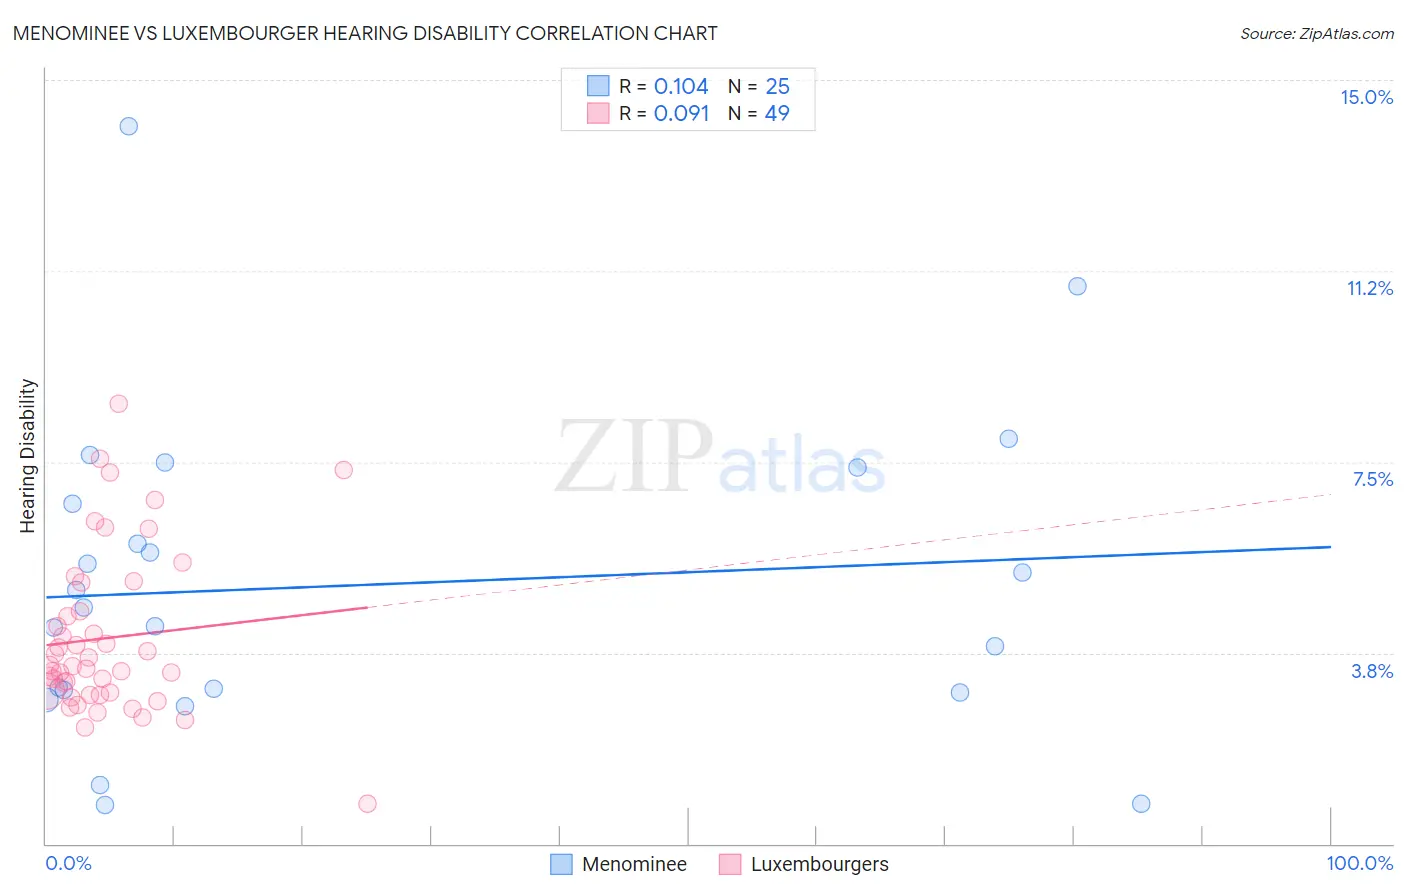
Menominee vs Luxembourger Hearing Disability Correlation Chart
The statistical analysis conducted on geographies consisting of 45,777,415 people shows a poor positive correlation between the proportion of Menominee and percentage of population with hearing disability in the United States with a correlation coefficient (R) of 0.104 and weighted average of 3.7%. Similarly, the statistical analysis conducted on geographies consisting of 144,678,787 people shows a slight positive correlation between the proportion of Luxembourgers and percentage of population with hearing disability in the United States with a correlation coefficient (R) of 0.091 and weighted average of 3.2%, a difference of 15.5%.
Hearing Disability Correlation Summary
| Measurement | Menominee | Luxembourger |
| Minimum | 0.77% | 0.78% |
| Maximum | 14.1% | 8.6% |
| Range | 13.3% | 7.9% |
| Mean | 5.1% | 4.0% |
| Median | 4.6% | 3.5% |
| Interquartile 25% (IQ1) | 3.0% | 2.9% |
| Interquartile 75% (IQ3) | 7.0% | 4.9% |
| Interquartile Range (IQR) | 4.0% | 1.9% |
| Standard Deviation (Sample) | 3.1% | 1.6% |
| Standard Deviation (Population) | 3.0% | 1.6% |
Similar Demographics by Hearing Disability
Demographics Similar to Menominee by Hearing Disability
In terms of hearing disability, the demographic groups most similar to Menominee are Dutch (3.7%, a difference of 0.060%), Pennsylvania German (3.7%, a difference of 0.16%), Scottish (3.7%, a difference of 0.19%), German (3.7%, a difference of 0.25%), and French (3.8%, a difference of 0.30%).
| Demographics | Rating | Rank | Hearing Disability |
| Pima | 0.0 /100 | #296 | Tragic 3.7% |
| Immigrants | Azores | 0.0 /100 | #297 | Tragic 3.7% |
| Celtics | 0.0 /100 | #298 | Tragic 3.7% |
| Germans | 0.0 /100 | #299 | Tragic 3.7% |
| Scottish | 0.0 /100 | #300 | Tragic 3.7% |
| Pennsylvania Germans | 0.0 /100 | #301 | Tragic 3.7% |
| Dutch | 0.0 /100 | #302 | Tragic 3.7% |
| Menominee | 0.0 /100 | #303 | Tragic 3.7% |
| French | 0.0 /100 | #304 | Tragic 3.8% |
| English | 0.0 /100 | #305 | Tragic 3.8% |
| Marshallese | 0.0 /100 | #306 | Tragic 3.8% |
| French Canadians | 0.0 /100 | #307 | Tragic 3.8% |
| Ottawa | 0.0 /100 | #308 | Tragic 3.8% |
| Scotch-Irish | 0.0 /100 | #309 | Tragic 3.8% |
| Cree | 0.0 /100 | #310 | Tragic 3.8% |
Demographics Similar to Luxembourgers by Hearing Disability
In terms of hearing disability, the demographic groups most similar to Luxembourgers are Ukrainian (3.2%, a difference of 0.050%), Greek (3.2%, a difference of 0.23%), Estonian (3.3%, a difference of 0.42%), Central American Indian (3.3%, a difference of 0.49%), and Guamanian/Chamorro (3.3%, a difference of 0.60%).
| Demographics | Rating | Rank | Hearing Disability |
| Icelanders | 5.2 /100 | #224 | Tragic 3.2% |
| Latvians | 5.1 /100 | #225 | Tragic 3.2% |
| Lebanese | 5.0 /100 | #226 | Tragic 3.2% |
| Bhutanese | 4.6 /100 | #227 | Tragic 3.2% |
| Immigrants | Portugal | 4.3 /100 | #228 | Tragic 3.2% |
| Maltese | 4.1 /100 | #229 | Tragic 3.2% |
| Greeks | 3.2 /100 | #230 | Tragic 3.2% |
| Luxembourgers | 2.9 /100 | #231 | Tragic 3.2% |
| Ukrainians | 2.9 /100 | #232 | Tragic 3.2% |
| Estonians | 2.4 /100 | #233 | Tragic 3.3% |
| Central American Indians | 2.3 /100 | #234 | Tragic 3.3% |
| Guamanians/Chamorros | 2.2 /100 | #235 | Tragic 3.3% |
| Serbians | 2.2 /100 | #236 | Tragic 3.3% |
| Immigrants | Austria | 1.8 /100 | #237 | Tragic 3.3% |
| German Russians | 1.8 /100 | #238 | Tragic 3.3% |