German vs Immigrants from Malaysia Ambulatory Disability
COMPARE
German
Immigrants from Malaysia
Ambulatory Disability
Ambulatory Disability Comparison
Germans
Immigrants from Malaysia
6.5%
AMBULATORY DISABILITY
1.5/ 100
METRIC RATING
243rd/ 347
METRIC RANK
5.5%
AMBULATORY DISABILITY
100.0/ 100
METRIC RATING
36th/ 347
METRIC RANK
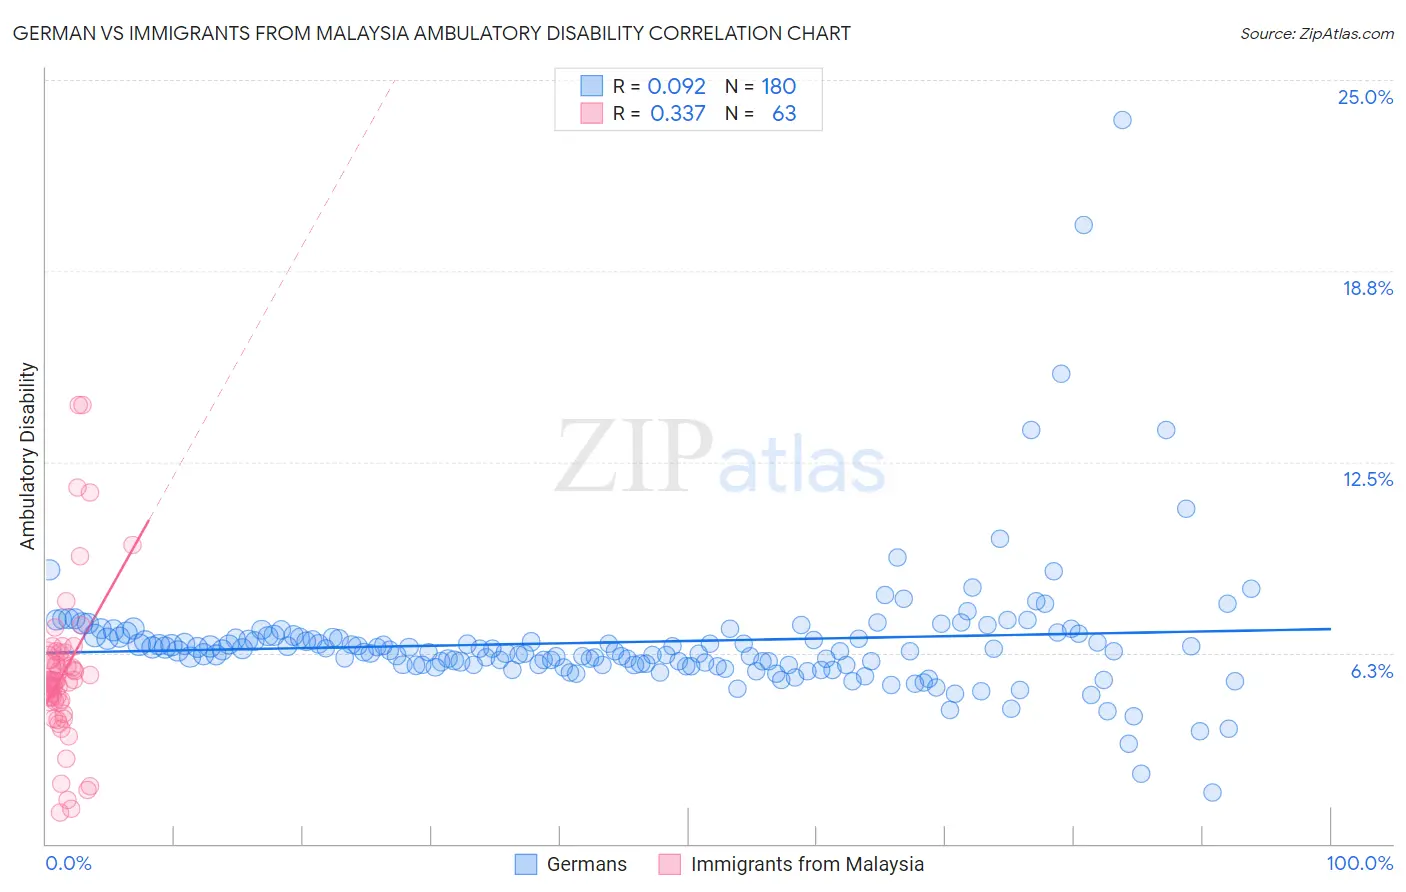
German vs Immigrants from Malaysia Ambulatory Disability Correlation Chart
The statistical analysis conducted on geographies consisting of 580,433,029 people shows a slight positive correlation between the proportion of Germans and percentage of population with ambulatory disability in the United States with a correlation coefficient (R) of 0.092 and weighted average of 6.5%. Similarly, the statistical analysis conducted on geographies consisting of 197,959,775 people shows a mild positive correlation between the proportion of Immigrants from Malaysia and percentage of population with ambulatory disability in the United States with a correlation coefficient (R) of 0.337 and weighted average of 5.5%, a difference of 17.8%.
Ambulatory Disability Correlation Summary
| Measurement | German | Immigrants from Malaysia |
| Minimum | 1.7% | 1.0% |
| Maximum | 23.7% | 14.4% |
| Range | 22.0% | 13.3% |
| Mean | 6.6% | 5.6% |
| Median | 6.3% | 5.3% |
| Interquartile 25% (IQ1) | 5.9% | 4.7% |
| Interquartile 75% (IQ3) | 6.8% | 6.1% |
| Interquartile Range (IQR) | 0.93% | 1.4% |
| Standard Deviation (Sample) | 2.2% | 2.6% |
| Standard Deviation (Population) | 2.2% | 2.5% |
Similar Demographics by Ambulatory Disability
Demographics Similar to Germans by Ambulatory Disability
In terms of ambulatory disability, the demographic groups most similar to Germans are Immigrants from Panama (6.5%, a difference of 0.0%), Spaniard (6.5%, a difference of 0.020%), Tlingit-Haida (6.5%, a difference of 0.040%), Immigrants from Haiti (6.5%, a difference of 0.050%), and Armenian (6.5%, a difference of 0.050%).
| Demographics | Rating | Rank | Ambulatory Disability |
| Dutch | 2.0 /100 | #236 | Tragic 6.4% |
| Immigrants | Germany | 1.8 /100 | #237 | Tragic 6.4% |
| Haitians | 1.8 /100 | #238 | Tragic 6.4% |
| Senegalese | 1.7 /100 | #239 | Tragic 6.4% |
| Immigrants | Senegal | 1.7 /100 | #240 | Tragic 6.4% |
| Immigrants | Haiti | 1.6 /100 | #241 | Tragic 6.5% |
| Spaniards | 1.6 /100 | #242 | Tragic 6.5% |
| Germans | 1.5 /100 | #243 | Tragic 6.5% |
| Immigrants | Panama | 1.5 /100 | #244 | Tragic 6.5% |
| Tlingit-Haida | 1.5 /100 | #245 | Tragic 6.5% |
| Armenians | 1.5 /100 | #246 | Tragic 6.5% |
| Immigrants | Cuba | 1.4 /100 | #247 | Tragic 6.5% |
| Immigrants | Portugal | 1.4 /100 | #248 | Tragic 6.5% |
| Native Hawaiians | 1.1 /100 | #249 | Tragic 6.5% |
| Chinese | 1.0 /100 | #250 | Tragic 6.5% |
Demographics Similar to Immigrants from Malaysia by Ambulatory Disability
In terms of ambulatory disability, the demographic groups most similar to Immigrants from Malaysia are Turkish (5.5%, a difference of 0.020%), Cypriot (5.5%, a difference of 0.020%), Afghan (5.5%, a difference of 0.070%), Immigrants from Asia (5.5%, a difference of 0.11%), and Immigrants from Eritrea (5.5%, a difference of 0.11%).
| Demographics | Rating | Rank | Ambulatory Disability |
| Immigrants | Iran | 100.0 /100 | #29 | Exceptional 5.4% |
| Immigrants | Turkey | 100.0 /100 | #30 | Exceptional 5.4% |
| Immigrants | Venezuela | 100.0 /100 | #31 | Exceptional 5.4% |
| Immigrants | Australia | 100.0 /100 | #32 | Exceptional 5.5% |
| Immigrants | Pakistan | 100.0 /100 | #33 | Exceptional 5.5% |
| Immigrants | Asia | 100.0 /100 | #34 | Exceptional 5.5% |
| Afghans | 100.0 /100 | #35 | Exceptional 5.5% |
| Immigrants | Malaysia | 100.0 /100 | #36 | Exceptional 5.5% |
| Turks | 100.0 /100 | #37 | Exceptional 5.5% |
| Cypriots | 100.0 /100 | #38 | Exceptional 5.5% |
| Immigrants | Eritrea | 100.0 /100 | #39 | Exceptional 5.5% |
| Venezuelans | 99.9 /100 | #40 | Exceptional 5.5% |
| Mongolians | 99.9 /100 | #41 | Exceptional 5.5% |
| Argentineans | 99.9 /100 | #42 | Exceptional 5.5% |
| Paraguayans | 99.9 /100 | #43 | Exceptional 5.5% |