German vs Immigrants from Belgium Ambulatory Disability
COMPARE
German
Immigrants from Belgium
Ambulatory Disability
Ambulatory Disability Comparison
Germans
Immigrants from Belgium
6.5%
AMBULATORY DISABILITY
1.5/ 100
METRIC RATING
243rd/ 347
METRIC RANK
5.6%
AMBULATORY DISABILITY
99.7/ 100
METRIC RATING
61st/ 347
METRIC RANK
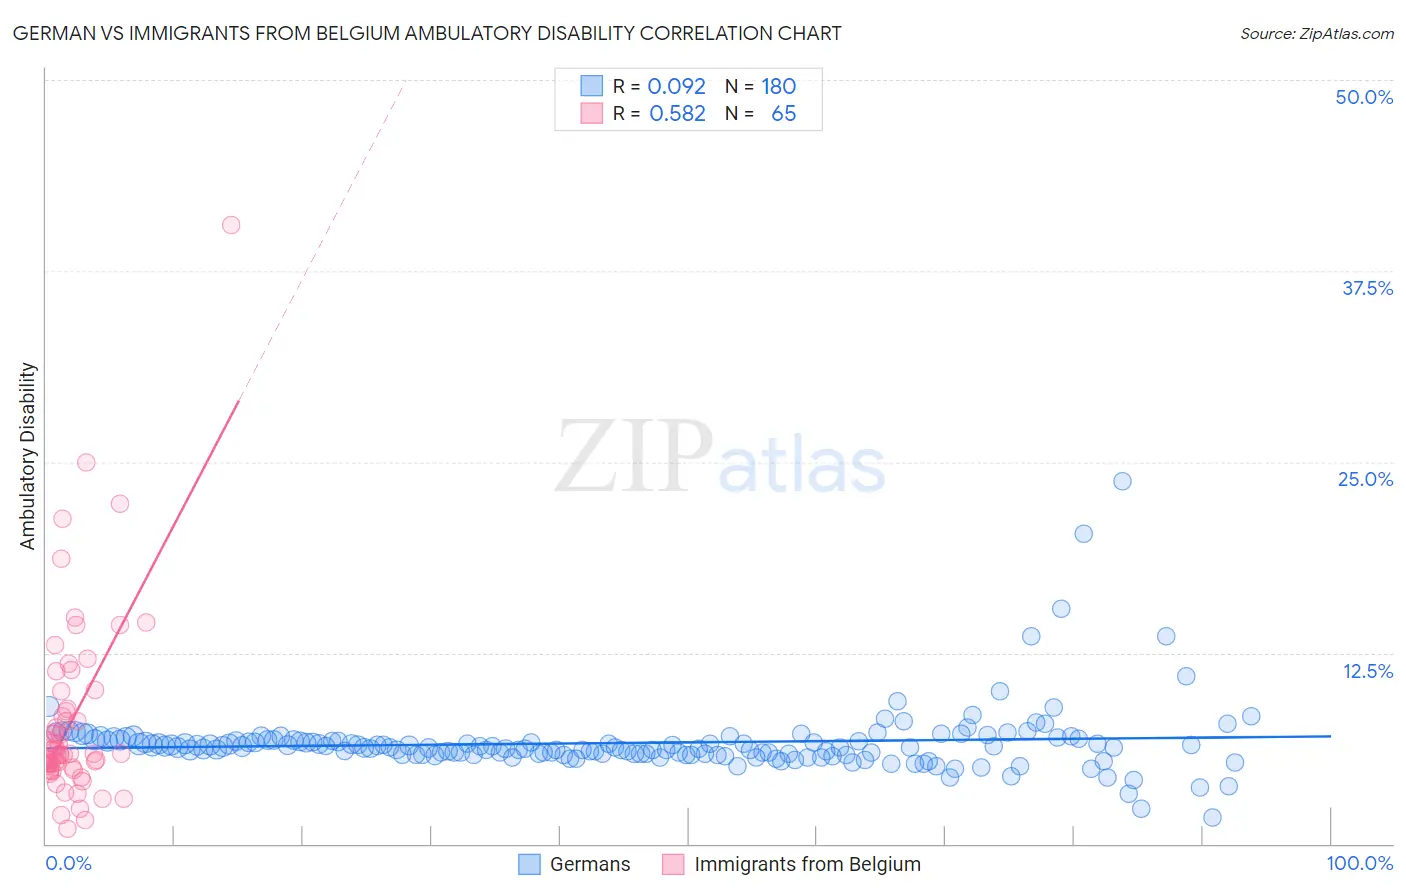
German vs Immigrants from Belgium Ambulatory Disability Correlation Chart
The statistical analysis conducted on geographies consisting of 580,433,029 people shows a slight positive correlation between the proportion of Germans and percentage of population with ambulatory disability in the United States with a correlation coefficient (R) of 0.092 and weighted average of 6.5%. Similarly, the statistical analysis conducted on geographies consisting of 146,707,151 people shows a substantial positive correlation between the proportion of Immigrants from Belgium and percentage of population with ambulatory disability in the United States with a correlation coefficient (R) of 0.582 and weighted average of 5.6%, a difference of 14.5%.
Ambulatory Disability Correlation Summary
| Measurement | German | Immigrants from Belgium |
| Minimum | 1.7% | 0.96% |
| Maximum | 23.7% | 40.5% |
| Range | 22.0% | 39.5% |
| Mean | 6.6% | 8.1% |
| Median | 6.3% | 5.9% |
| Interquartile 25% (IQ1) | 5.9% | 4.9% |
| Interquartile 75% (IQ3) | 6.8% | 9.4% |
| Interquartile Range (IQR) | 0.93% | 4.5% |
| Standard Deviation (Sample) | 2.2% | 6.3% |
| Standard Deviation (Population) | 2.2% | 6.3% |
Similar Demographics by Ambulatory Disability
Demographics Similar to Germans by Ambulatory Disability
In terms of ambulatory disability, the demographic groups most similar to Germans are Immigrants from Panama (6.5%, a difference of 0.0%), Spaniard (6.5%, a difference of 0.020%), Tlingit-Haida (6.5%, a difference of 0.040%), Immigrants from Haiti (6.5%, a difference of 0.050%), and Armenian (6.5%, a difference of 0.050%).
| Demographics | Rating | Rank | Ambulatory Disability |
| Dutch | 2.0 /100 | #236 | Tragic 6.4% |
| Immigrants | Germany | 1.8 /100 | #237 | Tragic 6.4% |
| Haitians | 1.8 /100 | #238 | Tragic 6.4% |
| Senegalese | 1.7 /100 | #239 | Tragic 6.4% |
| Immigrants | Senegal | 1.7 /100 | #240 | Tragic 6.4% |
| Immigrants | Haiti | 1.6 /100 | #241 | Tragic 6.5% |
| Spaniards | 1.6 /100 | #242 | Tragic 6.5% |
| Germans | 1.5 /100 | #243 | Tragic 6.5% |
| Immigrants | Panama | 1.5 /100 | #244 | Tragic 6.5% |
| Tlingit-Haida | 1.5 /100 | #245 | Tragic 6.5% |
| Armenians | 1.5 /100 | #246 | Tragic 6.5% |
| Immigrants | Cuba | 1.4 /100 | #247 | Tragic 6.5% |
| Immigrants | Portugal | 1.4 /100 | #248 | Tragic 6.5% |
| Native Hawaiians | 1.1 /100 | #249 | Tragic 6.5% |
| Chinese | 1.0 /100 | #250 | Tragic 6.5% |
Demographics Similar to Immigrants from Belgium by Ambulatory Disability
In terms of ambulatory disability, the demographic groups most similar to Immigrants from Belgium are Immigrants from Spain (5.6%, a difference of 0.010%), Immigrants from Lithuania (5.6%, a difference of 0.12%), Immigrants from France (5.6%, a difference of 0.13%), Immigrants from Afghanistan (5.6%, a difference of 0.16%), and Immigrants from Zimbabwe (5.6%, a difference of 0.20%).
| Demographics | Rating | Rank | Ambulatory Disability |
| Immigrants | Eastern Africa | 99.8 /100 | #54 | Exceptional 5.6% |
| Immigrants | Bulgaria | 99.8 /100 | #55 | Exceptional 5.6% |
| Inupiat | 99.8 /100 | #56 | Exceptional 5.6% |
| Immigrants | Brazil | 99.8 /100 | #57 | Exceptional 5.6% |
| Immigrants | Zimbabwe | 99.8 /100 | #58 | Exceptional 5.6% |
| Immigrants | Afghanistan | 99.8 /100 | #59 | Exceptional 5.6% |
| Immigrants | Lithuania | 99.8 /100 | #60 | Exceptional 5.6% |
| Immigrants | Belgium | 99.7 /100 | #61 | Exceptional 5.6% |
| Immigrants | Spain | 99.7 /100 | #62 | Exceptional 5.6% |
| Immigrants | France | 99.7 /100 | #63 | Exceptional 5.6% |
| Laotians | 99.7 /100 | #64 | Exceptional 5.7% |
| Immigrants | Switzerland | 99.7 /100 | #65 | Exceptional 5.7% |
| Israelis | 99.6 /100 | #66 | Exceptional 5.7% |
| Immigrants | Uganda | 99.6 /100 | #67 | Exceptional 5.7% |
| Sri Lankans | 99.6 /100 | #68 | Exceptional 5.7% |