Marshallese vs Immigrants from Iran Hearing Disability
COMPARE
Marshallese
Immigrants from Iran
Hearing Disability
Hearing Disability Comparison
Marshallese
Immigrants from Iran
3.8%
HEARING DISABILITY
0.0/ 100
METRIC RATING
306th/ 347
METRIC RANK
2.8%
HEARING DISABILITY
96.8/ 100
METRIC RATING
86th/ 347
METRIC RANK
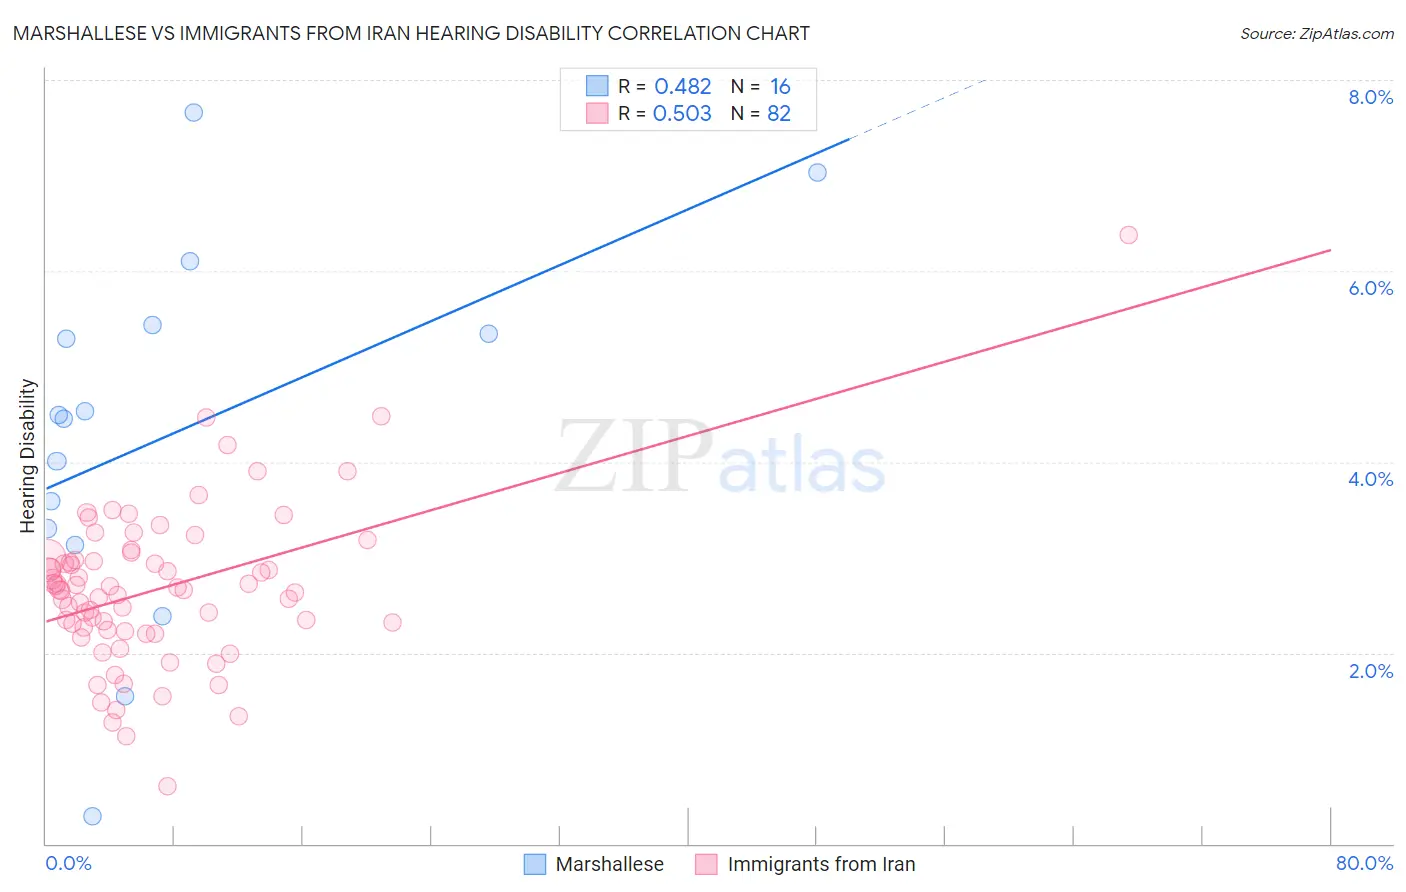
Marshallese vs Immigrants from Iran Hearing Disability Correlation Chart
The statistical analysis conducted on geographies consisting of 14,761,315 people shows a moderate positive correlation between the proportion of Marshallese and percentage of population with hearing disability in the United States with a correlation coefficient (R) of 0.482 and weighted average of 3.8%. Similarly, the statistical analysis conducted on geographies consisting of 279,867,753 people shows a substantial positive correlation between the proportion of Immigrants from Iran and percentage of population with hearing disability in the United States with a correlation coefficient (R) of 0.503 and weighted average of 2.8%, a difference of 38.2%.
Hearing Disability Correlation Summary
| Measurement | Marshallese | Immigrants from Iran |
| Minimum | 0.29% | 0.60% |
| Maximum | 7.7% | 6.4% |
| Range | 7.4% | 5.8% |
| Mean | 4.3% | 2.7% |
| Median | 4.5% | 2.7% |
| Interquartile 25% (IQ1) | 3.2% | 2.2% |
| Interquartile 75% (IQ3) | 5.4% | 3.0% |
| Interquartile Range (IQR) | 2.2% | 0.74% |
| Standard Deviation (Sample) | 1.9% | 0.83% |
| Standard Deviation (Population) | 1.9% | 0.82% |
Similar Demographics by Hearing Disability
Demographics Similar to Marshallese by Hearing Disability
In terms of hearing disability, the demographic groups most similar to Marshallese are French Canadian (3.8%, a difference of 0.12%), Ottawa (3.8%, a difference of 0.56%), Scotch-Irish (3.8%, a difference of 0.64%), English (3.8%, a difference of 0.86%), and Cree (3.8%, a difference of 0.95%).
| Demographics | Rating | Rank | Hearing Disability |
| Germans | 0.0 /100 | #299 | Tragic 3.7% |
| Scottish | 0.0 /100 | #300 | Tragic 3.7% |
| Pennsylvania Germans | 0.0 /100 | #301 | Tragic 3.7% |
| Dutch | 0.0 /100 | #302 | Tragic 3.7% |
| Menominee | 0.0 /100 | #303 | Tragic 3.7% |
| French | 0.0 /100 | #304 | Tragic 3.8% |
| English | 0.0 /100 | #305 | Tragic 3.8% |
| Marshallese | 0.0 /100 | #306 | Tragic 3.8% |
| French Canadians | 0.0 /100 | #307 | Tragic 3.8% |
| Ottawa | 0.0 /100 | #308 | Tragic 3.8% |
| Scotch-Irish | 0.0 /100 | #309 | Tragic 3.8% |
| Cree | 0.0 /100 | #310 | Tragic 3.8% |
| Americans | 0.0 /100 | #311 | Tragic 3.9% |
| Cajuns | 0.0 /100 | #312 | Tragic 3.9% |
| Hopi | 0.0 /100 | #313 | Tragic 3.9% |
Demographics Similar to Immigrants from Iran by Hearing Disability
In terms of hearing disability, the demographic groups most similar to Immigrants from Iran are Immigrants from Northern Africa (2.8%, a difference of 0.020%), Immigrants from Argentina (2.8%, a difference of 0.10%), Somali (2.8%, a difference of 0.11%), Immigrants from Turkey (2.8%, a difference of 0.14%), and Belizean (2.8%, a difference of 0.17%).
| Demographics | Rating | Rank | Hearing Disability |
| Colombians | 97.4 /100 | #79 | Exceptional 2.7% |
| Immigrants | Asia | 97.2 /100 | #80 | Exceptional 2.7% |
| Immigrants | Uruguay | 97.2 /100 | #81 | Exceptional 2.7% |
| Immigrants | Armenia | 97.2 /100 | #82 | Exceptional 2.7% |
| Immigrants | Cuba | 97.2 /100 | #83 | Exceptional 2.7% |
| Immigrants | Argentina | 97.0 /100 | #84 | Exceptional 2.8% |
| Immigrants | Northern Africa | 96.9 /100 | #85 | Exceptional 2.8% |
| Immigrants | Iran | 96.8 /100 | #86 | Exceptional 2.8% |
| Somalis | 96.7 /100 | #87 | Exceptional 2.8% |
| Immigrants | Turkey | 96.7 /100 | #88 | Exceptional 2.8% |
| Belizeans | 96.6 /100 | #89 | Exceptional 2.8% |
| Immigrants | Morocco | 96.6 /100 | #90 | Exceptional 2.8% |
| Immigrants | Middle Africa | 96.5 /100 | #91 | Exceptional 2.8% |
| Iranians | 96.4 /100 | #92 | Exceptional 2.8% |
| Immigrants | Kuwait | 96.3 /100 | #93 | Exceptional 2.8% |