Spanish American vs Immigrants from Micronesia Hearing Disability
COMPARE
Spanish American
Immigrants from Micronesia
Hearing Disability
Hearing Disability Comparison
Spanish Americans
Immigrants from Micronesia
4.0%
HEARING DISABILITY
0.0/ 100
METRIC RATING
316th/ 347
METRIC RANK
3.6%
HEARING DISABILITY
0.0/ 100
METRIC RATING
284th/ 347
METRIC RANK
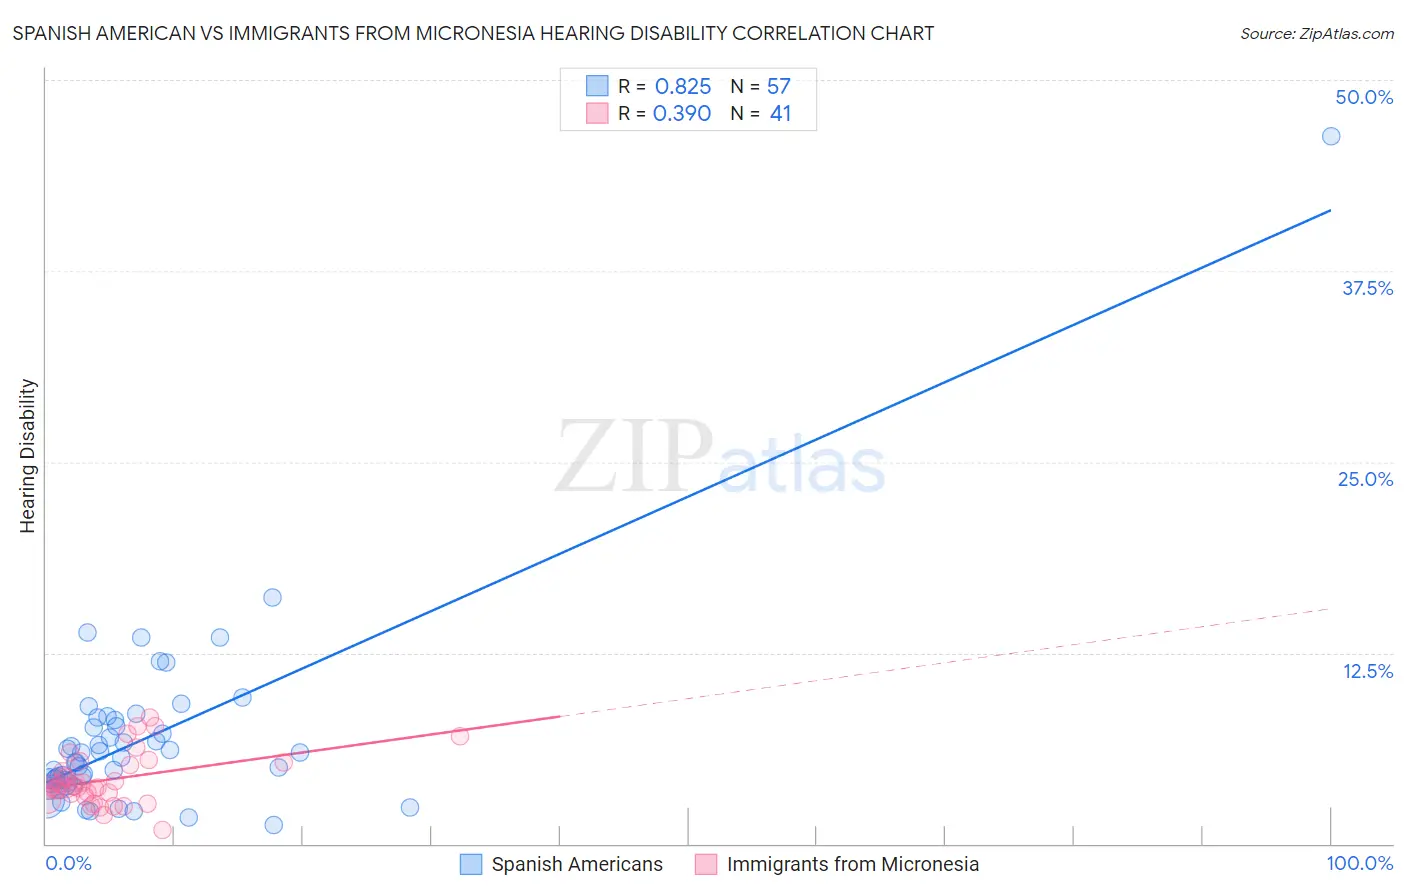
Spanish American vs Immigrants from Micronesia Hearing Disability Correlation Chart
The statistical analysis conducted on geographies consisting of 103,164,367 people shows a very strong positive correlation between the proportion of Spanish Americans and percentage of population with hearing disability in the United States with a correlation coefficient (R) of 0.825 and weighted average of 4.0%. Similarly, the statistical analysis conducted on geographies consisting of 61,571,730 people shows a mild positive correlation between the proportion of Immigrants from Micronesia and percentage of population with hearing disability in the United States with a correlation coefficient (R) of 0.390 and weighted average of 3.6%, a difference of 8.8%.
Hearing Disability Correlation Summary
| Measurement | Spanish American | Immigrants from Micronesia |
| Minimum | 1.3% | 0.94% |
| Maximum | 46.3% | 8.3% |
| Range | 45.0% | 7.3% |
| Mean | 6.8% | 4.2% |
| Median | 5.4% | 3.7% |
| Interquartile 25% (IQ1) | 4.0% | 3.2% |
| Interquartile 75% (IQ3) | 7.9% | 5.3% |
| Interquartile Range (IQR) | 3.9% | 2.0% |
| Standard Deviation (Sample) | 6.3% | 1.7% |
| Standard Deviation (Population) | 6.2% | 1.7% |
Similar Demographics by Hearing Disability
Demographics Similar to Spanish Americans by Hearing Disability
In terms of hearing disability, the demographic groups most similar to Spanish Americans are Comanche (4.0%, a difference of 0.13%), Puget Sound Salish (3.9%, a difference of 0.20%), Yakama (3.9%, a difference of 0.21%), Cheyenne (4.0%, a difference of 0.31%), and Hopi (3.9%, a difference of 0.38%).
| Demographics | Rating | Rank | Hearing Disability |
| Scotch-Irish | 0.0 /100 | #309 | Tragic 3.8% |
| Cree | 0.0 /100 | #310 | Tragic 3.8% |
| Americans | 0.0 /100 | #311 | Tragic 3.9% |
| Cajuns | 0.0 /100 | #312 | Tragic 3.9% |
| Hopi | 0.0 /100 | #313 | Tragic 3.9% |
| Yakama | 0.0 /100 | #314 | Tragic 3.9% |
| Puget Sound Salish | 0.0 /100 | #315 | Tragic 3.9% |
| Spanish Americans | 0.0 /100 | #316 | Tragic 4.0% |
| Comanche | 0.0 /100 | #317 | Tragic 4.0% |
| Cheyenne | 0.0 /100 | #318 | Tragic 4.0% |
| Chippewa | 0.0 /100 | #319 | Tragic 4.0% |
| Shoshone | 0.0 /100 | #320 | Tragic 4.0% |
| Paiute | 0.0 /100 | #321 | Tragic 4.1% |
| Seminole | 0.0 /100 | #322 | Tragic 4.1% |
| Apache | 0.0 /100 | #323 | Tragic 4.1% |
Demographics Similar to Immigrants from Micronesia by Hearing Disability
In terms of hearing disability, the demographic groups most similar to Immigrants from Micronesia are Sioux (3.6%, a difference of 0.10%), Delaware (3.6%, a difference of 0.13%), Spanish (3.7%, a difference of 0.38%), Blackfeet (3.6%, a difference of 0.47%), and Swedish (3.6%, a difference of 0.72%).
| Demographics | Rating | Rank | Hearing Disability |
| Immigrants | Nonimmigrants | 0.0 /100 | #277 | Tragic 3.6% |
| Basques | 0.0 /100 | #278 | Tragic 3.6% |
| Slovaks | 0.0 /100 | #279 | Tragic 3.6% |
| French American Indians | 0.0 /100 | #280 | Tragic 3.6% |
| Scandinavians | 0.0 /100 | #281 | Tragic 3.6% |
| Swedes | 0.0 /100 | #282 | Tragic 3.6% |
| Blackfeet | 0.0 /100 | #283 | Tragic 3.6% |
| Immigrants | Micronesia | 0.0 /100 | #284 | Tragic 3.6% |
| Sioux | 0.0 /100 | #285 | Tragic 3.6% |
| Delaware | 0.0 /100 | #286 | Tragic 3.6% |
| Spanish | 0.0 /100 | #287 | Tragic 3.7% |
| Irish | 0.0 /100 | #288 | Tragic 3.7% |
| Chinese | 0.0 /100 | #289 | Tragic 3.7% |
| Whites/Caucasians | 0.0 /100 | #290 | Tragic 3.7% |
| Finns | 0.0 /100 | #291 | Tragic 3.7% |