Serbian vs Immigrants from Kuwait Female Disability
COMPARE
Serbian
Immigrants from Kuwait
Female Disability
Female Disability Comparison
Serbians
Immigrants from Kuwait
12.3%
FEMALE DISABILITY
33.1/ 100
METRIC RATING
187th/ 347
METRIC RANK
11.1%
FEMALE DISABILITY
100.0/ 100
METRIC RATING
31st/ 347
METRIC RANK
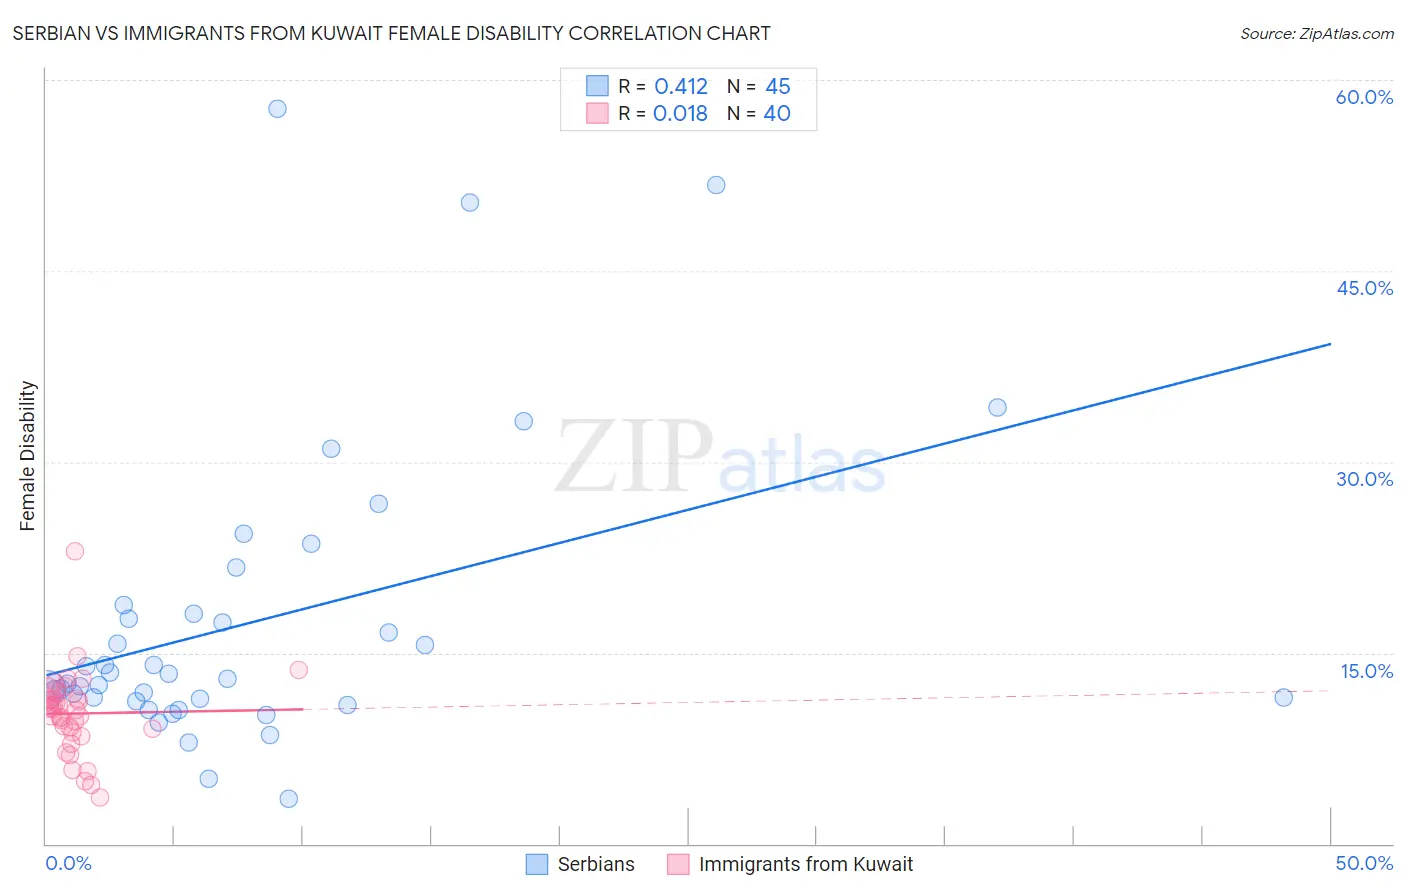
Serbian vs Immigrants from Kuwait Female Disability Correlation Chart
The statistical analysis conducted on geographies consisting of 267,642,282 people shows a moderate positive correlation between the proportion of Serbians and percentage of females with a disability in the United States with a correlation coefficient (R) of 0.412 and weighted average of 12.3%. Similarly, the statistical analysis conducted on geographies consisting of 136,914,007 people shows no correlation between the proportion of Immigrants from Kuwait and percentage of females with a disability in the United States with a correlation coefficient (R) of 0.018 and weighted average of 11.1%, a difference of 10.5%.
Female Disability Correlation Summary
| Measurement | Serbian | Immigrants from Kuwait |
| Minimum | 3.5% | 3.7% |
| Maximum | 57.7% | 22.9% |
| Range | 54.2% | 19.3% |
| Mean | 17.5% | 10.2% |
| Median | 12.9% | 10.6% |
| Interquartile 25% (IQ1) | 11.3% | 8.9% |
| Interquartile 75% (IQ3) | 18.4% | 11.6% |
| Interquartile Range (IQR) | 7.2% | 2.7% |
| Standard Deviation (Sample) | 11.8% | 3.3% |
| Standard Deviation (Population) | 11.6% | 3.2% |
Similar Demographics by Female Disability
Demographics Similar to Serbians by Female Disability
In terms of female disability, the demographic groups most similar to Serbians are Austrian (12.3%, a difference of 0.010%), Immigrants from North America (12.3%, a difference of 0.010%), Immigrants from Uzbekistan (12.3%, a difference of 0.030%), Immigrants from Albania (12.3%, a difference of 0.070%), and Immigrants from Honduras (12.3%, a difference of 0.080%).
| Demographics | Rating | Rank | Female Disability |
| Albanians | 37.9 /100 | #180 | Fair 12.3% |
| Immigrants | Canada | 37.2 /100 | #181 | Fair 12.3% |
| Norwegians | 36.9 /100 | #182 | Fair 12.3% |
| Cubans | 36.5 /100 | #183 | Fair 12.3% |
| Iraqis | 36.0 /100 | #184 | Fair 12.3% |
| Immigrants | Uzbekistan | 33.9 /100 | #185 | Fair 12.3% |
| Austrians | 33.3 /100 | #186 | Fair 12.3% |
| Serbians | 33.1 /100 | #187 | Fair 12.3% |
| Immigrants | North America | 32.8 /100 | #188 | Fair 12.3% |
| Immigrants | Albania | 31.6 /100 | #189 | Fair 12.3% |
| Immigrants | Honduras | 31.3 /100 | #190 | Fair 12.3% |
| Armenians | 29.7 /100 | #191 | Fair 12.3% |
| Immigrants | Western Africa | 29.2 /100 | #192 | Fair 12.3% |
| Northern Europeans | 27.5 /100 | #193 | Fair 12.3% |
| Ukrainians | 27.2 /100 | #194 | Fair 12.3% |
Demographics Similar to Immigrants from Kuwait by Female Disability
In terms of female disability, the demographic groups most similar to Immigrants from Kuwait are Immigrants from Malaysia (11.1%, a difference of 0.10%), Turkish (11.1%, a difference of 0.10%), Egyptian (11.1%, a difference of 0.17%), Immigrants from Australia (11.1%, a difference of 0.17%), and Immigrants from Egypt (11.1%, a difference of 0.25%).
| Demographics | Rating | Rank | Female Disability |
| Immigrants | Argentina | 100.0 /100 | #24 | Exceptional 11.0% |
| Immigrants | Asia | 100.0 /100 | #25 | Exceptional 11.0% |
| Argentineans | 100.0 /100 | #26 | Exceptional 11.0% |
| Immigrants | Turkey | 100.0 /100 | #27 | Exceptional 11.1% |
| Egyptians | 100.0 /100 | #28 | Exceptional 11.1% |
| Immigrants | Malaysia | 100.0 /100 | #29 | Exceptional 11.1% |
| Turks | 100.0 /100 | #30 | Exceptional 11.1% |
| Immigrants | Kuwait | 100.0 /100 | #31 | Exceptional 11.1% |
| Immigrants | Australia | 100.0 /100 | #32 | Exceptional 11.1% |
| Immigrants | Egypt | 100.0 /100 | #33 | Exceptional 11.1% |
| Immigrants | Indonesia | 100.0 /100 | #34 | Exceptional 11.2% |
| Immigrants | Japan | 100.0 /100 | #35 | Exceptional 11.2% |
| Cypriots | 100.0 /100 | #36 | Exceptional 11.2% |
| Ethiopians | 100.0 /100 | #37 | Exceptional 11.2% |
| Immigrants | Ethiopia | 100.0 /100 | #38 | Exceptional 11.2% |