Marshallese vs Immigrants from Guyana Disability Age Under 5
COMPARE
Marshallese
Immigrants from Guyana
Disability Age Under 5
Disability Age Under 5 Comparison
Marshallese
Immigrants from Guyana
0.94%
DISABILITY AGE UNDER 5
100.0/ 100
METRIC RATING
10th/ 347
METRIC RANK
1.0%
DISABILITY AGE UNDER 5
99.9/ 100
METRIC RATING
38th/ 347
METRIC RANK
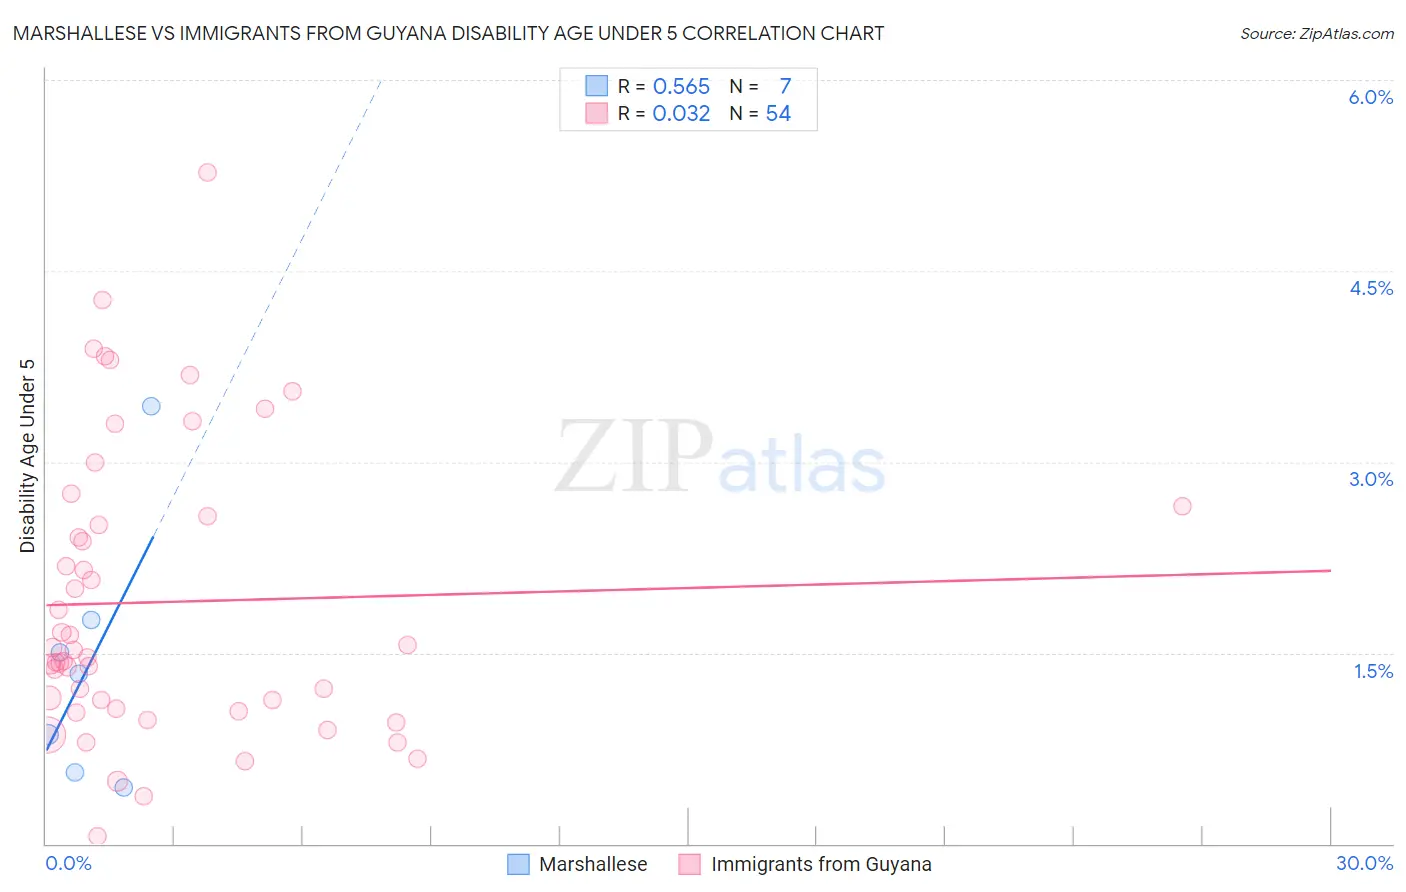
Marshallese vs Immigrants from Guyana Disability Age Under 5 Correlation Chart
The statistical analysis conducted on geographies consisting of 12,862,689 people shows a substantial positive correlation between the proportion of Marshallese and percentage of population with a disability under the age of 5 in the United States with a correlation coefficient (R) of 0.565 and weighted average of 0.94%. Similarly, the statistical analysis conducted on geographies consisting of 116,239,844 people shows no correlation between the proportion of Immigrants from Guyana and percentage of population with a disability under the age of 5 in the United States with a correlation coefficient (R) of 0.032 and weighted average of 1.0%, a difference of 11.6%.
Disability Age Under 5 Correlation Summary
| Measurement | Marshallese | Immigrants from Guyana |
| Minimum | 0.44% | 0.063% |
| Maximum | 3.4% | 5.3% |
| Range | 3.0% | 5.2% |
| Mean | 1.4% | 1.9% |
| Median | 1.3% | 1.5% |
| Interquartile 25% (IQ1) | 0.56% | 1.1% |
| Interquartile 75% (IQ3) | 1.8% | 2.6% |
| Interquartile Range (IQR) | 1.2% | 1.5% |
| Standard Deviation (Sample) | 1.0% | 1.1% |
| Standard Deviation (Population) | 0.94% | 1.1% |
Similar Demographics by Disability Age Under 5
Demographics Similar to Marshallese by Disability Age Under 5
In terms of disability age under 5, the demographic groups most similar to Marshallese are Afghan (0.94%, a difference of 0.76%), Immigrants from Grenada (0.94%, a difference of 0.78%), Soviet Union (0.95%, a difference of 0.95%), Yuman (0.95%, a difference of 1.0%), and Immigrants from Hong Kong (0.95%, a difference of 1.1%).
| Demographics | Rating | Rank | Disability Age Under 5 |
| Vietnamese | 100.0 /100 | #3 | Exceptional 0.81% |
| Immigrants | Uzbekistan | 100.0 /100 | #4 | Exceptional 0.85% |
| Immigrants | Bangladesh | 100.0 /100 | #5 | Exceptional 0.85% |
| Ute | 100.0 /100 | #6 | Exceptional 0.86% |
| Immigrants | Afghanistan | 100.0 /100 | #7 | Exceptional 0.91% |
| Immigrants | Yemen | 100.0 /100 | #8 | Exceptional 0.91% |
| Immigrants | Fiji | 100.0 /100 | #9 | Exceptional 0.92% |
| Marshallese | 100.0 /100 | #10 | Exceptional 0.94% |
| Afghans | 100.0 /100 | #11 | Exceptional 0.94% |
| Immigrants | Grenada | 100.0 /100 | #12 | Exceptional 0.94% |
| Soviet Union | 100.0 /100 | #13 | Exceptional 0.95% |
| Yuman | 100.0 /100 | #14 | Exceptional 0.95% |
| Immigrants | Hong Kong | 100.0 /100 | #15 | Exceptional 0.95% |
| Immigrants | Israel | 100.0 /100 | #16 | Exceptional 0.96% |
| Immigrants | China | 100.0 /100 | #17 | Exceptional 0.96% |
Demographics Similar to Immigrants from Guyana by Disability Age Under 5
In terms of disability age under 5, the demographic groups most similar to Immigrants from Guyana are Immigrants from India (1.0%, a difference of 0.080%), Immigrants from Nepal (1.0%, a difference of 0.11%), Filipino (1.1%, a difference of 0.67%), Barbadian (1.0%, a difference of 0.82%), and Immigrants from Albania (1.1%, a difference of 1.0%).
| Demographics | Rating | Rank | Disability Age Under 5 |
| Armenians | 99.9 /100 | #31 | Exceptional 1.0% |
| Iranians | 99.9 /100 | #32 | Exceptional 1.0% |
| Bolivians | 99.9 /100 | #33 | Exceptional 1.0% |
| Immigrants | Ukraine | 99.9 /100 | #34 | Exceptional 1.0% |
| Barbadians | 99.9 /100 | #35 | Exceptional 1.0% |
| Immigrants | Nepal | 99.9 /100 | #36 | Exceptional 1.0% |
| Immigrants | India | 99.9 /100 | #37 | Exceptional 1.0% |
| Immigrants | Guyana | 99.9 /100 | #38 | Exceptional 1.0% |
| Filipinos | 99.9 /100 | #39 | Exceptional 1.1% |
| Immigrants | Albania | 99.9 /100 | #40 | Exceptional 1.1% |
| Thais | 99.8 /100 | #41 | Exceptional 1.1% |
| Immigrants | Bulgaria | 99.8 /100 | #42 | Exceptional 1.1% |
| Pima | 99.8 /100 | #43 | Exceptional 1.1% |
| Immigrants | Asia | 99.8 /100 | #44 | Exceptional 1.1% |
| Immigrants | Turkey | 99.8 /100 | #45 | Exceptional 1.1% |