Marshallese vs Immigrants from Bolivia Disability Age Under 5
COMPARE
Marshallese
Immigrants from Bolivia
Disability Age Under 5
Disability Age Under 5 Comparison
Marshallese
Immigrants from Bolivia
0.94%
DISABILITY AGE UNDER 5
100.0/ 100
METRIC RATING
10th/ 347
METRIC RANK
1.1%
DISABILITY AGE UNDER 5
99.6/ 100
METRIC RATING
52nd/ 347
METRIC RANK
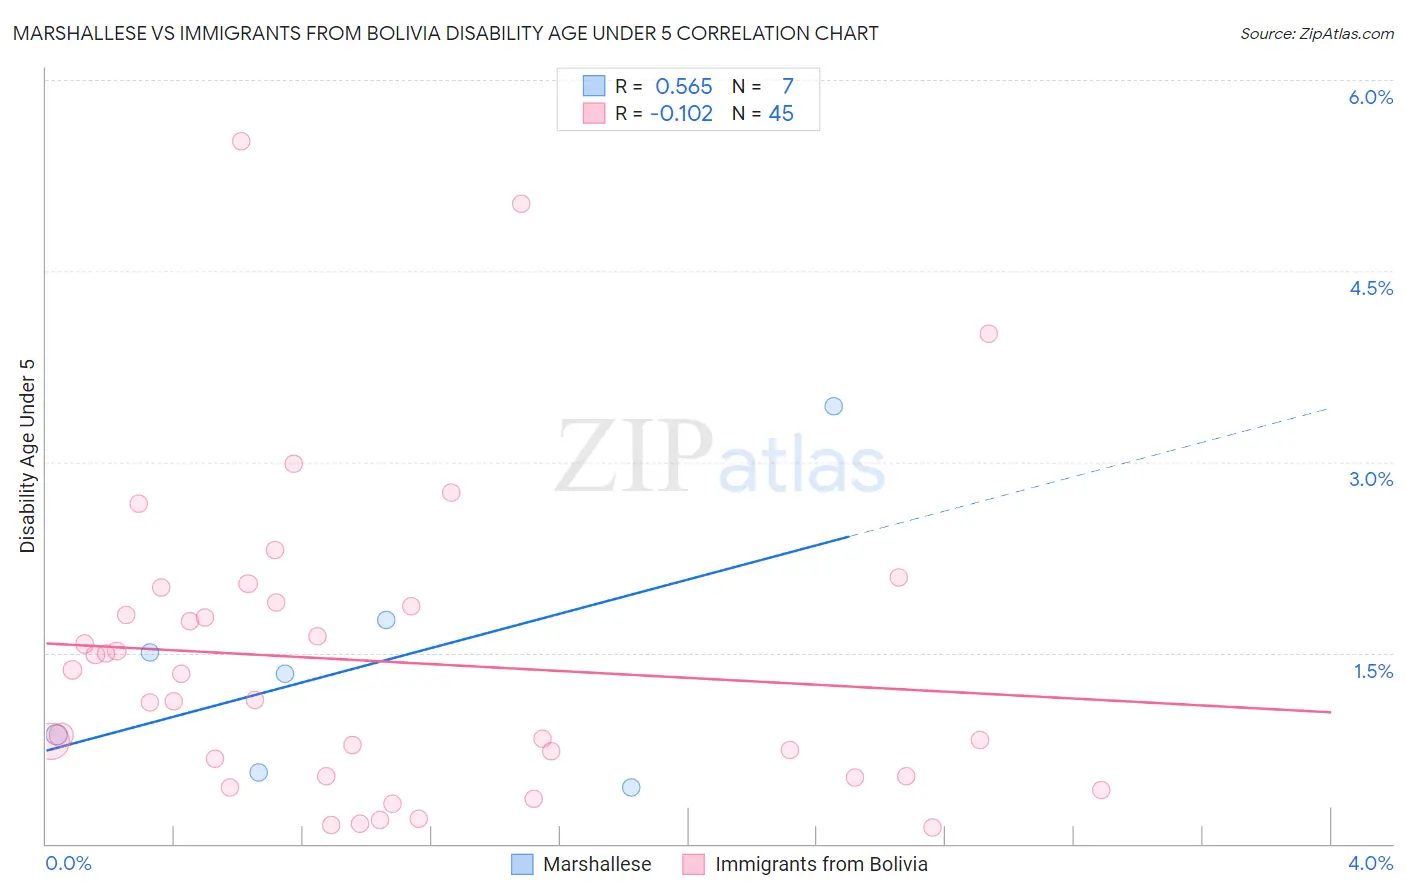
Marshallese vs Immigrants from Bolivia Disability Age Under 5 Correlation Chart
The statistical analysis conducted on geographies consisting of 12,862,689 people shows a substantial positive correlation between the proportion of Marshallese and percentage of population with a disability under the age of 5 in the United States with a correlation coefficient (R) of 0.565 and weighted average of 0.94%. Similarly, the statistical analysis conducted on geographies consisting of 110,789,799 people shows a poor negative correlation between the proportion of Immigrants from Bolivia and percentage of population with a disability under the age of 5 in the United States with a correlation coefficient (R) of -0.102 and weighted average of 1.1%, a difference of 15.5%.
Disability Age Under 5 Correlation Summary
| Measurement | Marshallese | Immigrants from Bolivia |
| Minimum | 0.44% | 0.13% |
| Maximum | 3.4% | 5.5% |
| Range | 3.0% | 5.4% |
| Mean | 1.4% | 1.4% |
| Median | 1.3% | 1.1% |
| Interquartile 25% (IQ1) | 0.56% | 0.53% |
| Interquartile 75% (IQ3) | 1.8% | 1.9% |
| Interquartile Range (IQR) | 1.2% | 1.3% |
| Standard Deviation (Sample) | 1.0% | 1.2% |
| Standard Deviation (Population) | 0.94% | 1.2% |
Similar Demographics by Disability Age Under 5
Demographics Similar to Marshallese by Disability Age Under 5
In terms of disability age under 5, the demographic groups most similar to Marshallese are Afghan (0.94%, a difference of 0.76%), Immigrants from Grenada (0.94%, a difference of 0.78%), Soviet Union (0.95%, a difference of 0.95%), Yuman (0.95%, a difference of 1.0%), and Immigrants from Hong Kong (0.95%, a difference of 1.1%).
| Demographics | Rating | Rank | Disability Age Under 5 |
| Vietnamese | 100.0 /100 | #3 | Exceptional 0.81% |
| Immigrants | Uzbekistan | 100.0 /100 | #4 | Exceptional 0.85% |
| Immigrants | Bangladesh | 100.0 /100 | #5 | Exceptional 0.85% |
| Ute | 100.0 /100 | #6 | Exceptional 0.86% |
| Immigrants | Afghanistan | 100.0 /100 | #7 | Exceptional 0.91% |
| Immigrants | Yemen | 100.0 /100 | #8 | Exceptional 0.91% |
| Immigrants | Fiji | 100.0 /100 | #9 | Exceptional 0.92% |
| Marshallese | 100.0 /100 | #10 | Exceptional 0.94% |
| Afghans | 100.0 /100 | #11 | Exceptional 0.94% |
| Immigrants | Grenada | 100.0 /100 | #12 | Exceptional 0.94% |
| Soviet Union | 100.0 /100 | #13 | Exceptional 0.95% |
| Yuman | 100.0 /100 | #14 | Exceptional 0.95% |
| Immigrants | Hong Kong | 100.0 /100 | #15 | Exceptional 0.95% |
| Immigrants | Israel | 100.0 /100 | #16 | Exceptional 0.96% |
| Immigrants | China | 100.0 /100 | #17 | Exceptional 0.96% |
Demographics Similar to Immigrants from Bolivia by Disability Age Under 5
In terms of disability age under 5, the demographic groups most similar to Immigrants from Bolivia are Asian (1.1%, a difference of 0.31%), Immigrants from Kazakhstan (1.1%, a difference of 0.42%), Immigrants from El Salvador (1.1%, a difference of 0.60%), Immigrants from Japan (1.1%, a difference of 0.61%), and Immigrants from Russia (1.1%, a difference of 0.63%).
| Demographics | Rating | Rank | Disability Age Under 5 |
| Immigrants | Turkey | 99.8 /100 | #45 | Exceptional 1.1% |
| Immigrants | Congo | 99.8 /100 | #46 | Exceptional 1.1% |
| Immigrants | Sweden | 99.8 /100 | #47 | Exceptional 1.1% |
| Immigrants | Singapore | 99.7 /100 | #48 | Exceptional 1.1% |
| Immigrants | Russia | 99.7 /100 | #49 | Exceptional 1.1% |
| Immigrants | Japan | 99.7 /100 | #50 | Exceptional 1.1% |
| Immigrants | Kazakhstan | 99.7 /100 | #51 | Exceptional 1.1% |
| Immigrants | Bolivia | 99.6 /100 | #52 | Exceptional 1.1% |
| Asians | 99.6 /100 | #53 | Exceptional 1.1% |
| Immigrants | El Salvador | 99.6 /100 | #54 | Exceptional 1.1% |
| Salvadorans | 99.5 /100 | #55 | Exceptional 1.1% |
| Ecuadorians | 99.5 /100 | #56 | Exceptional 1.1% |
| Assyrians/Chaldeans/Syriacs | 99.5 /100 | #57 | Exceptional 1.1% |
| Immigrants | Egypt | 99.4 /100 | #58 | Exceptional 1.1% |
| Immigrants | Malaysia | 99.4 /100 | #59 | Exceptional 1.1% |