Indian (Asian) vs Immigrants from Guyana Disability Age Under 5
COMPARE
Indian (Asian)
Immigrants from Guyana
Disability Age Under 5
Disability Age Under 5 Comparison
Indians (Asian)
Immigrants from Guyana
1.0%
DISABILITY AGE UNDER 5
100.0/ 100
METRIC RATING
24th/ 347
METRIC RANK
1.0%
DISABILITY AGE UNDER 5
99.9/ 100
METRIC RATING
38th/ 347
METRIC RANK
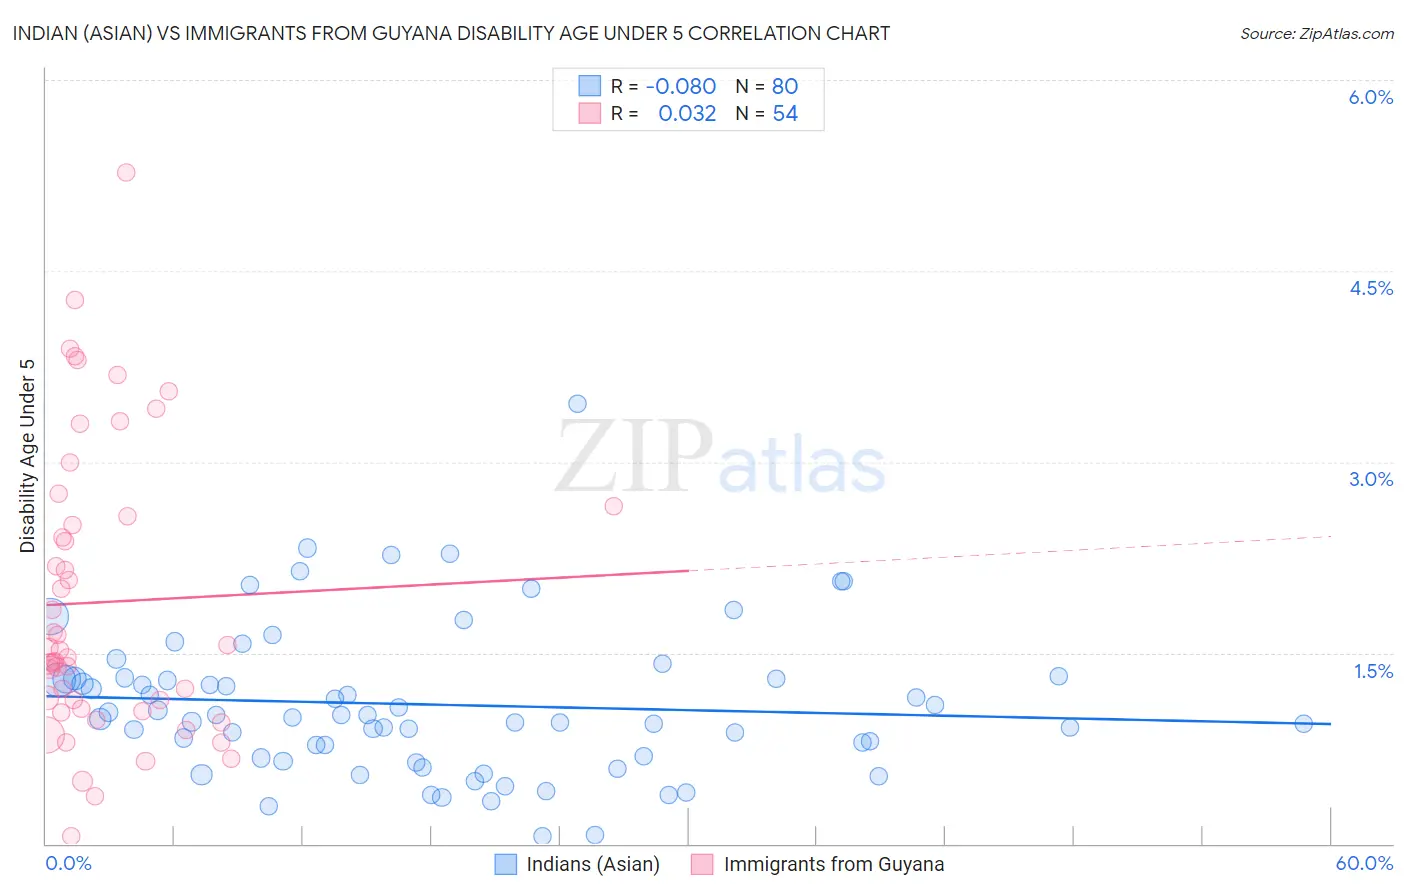
Indian (Asian) vs Immigrants from Guyana Disability Age Under 5 Correlation Chart
The statistical analysis conducted on geographies consisting of 247,409,982 people shows a slight negative correlation between the proportion of Indians (Asian) and percentage of population with a disability under the age of 5 in the United States with a correlation coefficient (R) of -0.080 and weighted average of 1.0%. Similarly, the statistical analysis conducted on geographies consisting of 116,239,844 people shows no correlation between the proportion of Immigrants from Guyana and percentage of population with a disability under the age of 5 in the United States with a correlation coefficient (R) of 0.032 and weighted average of 1.0%, a difference of 4.3%.
Disability Age Under 5 Correlation Summary
| Measurement | Indian (Asian) | Immigrants from Guyana |
| Minimum | 0.058% | 0.063% |
| Maximum | 3.5% | 5.3% |
| Range | 3.4% | 5.2% |
| Mean | 1.1% | 1.9% |
| Median | 1.0% | 1.5% |
| Interquartile 25% (IQ1) | 0.68% | 1.1% |
| Interquartile 75% (IQ3) | 1.3% | 2.6% |
| Interquartile Range (IQR) | 0.62% | 1.5% |
| Standard Deviation (Sample) | 0.59% | 1.1% |
| Standard Deviation (Population) | 0.59% | 1.1% |
Demographics Similar to Indians (Asian) and Immigrants from Guyana by Disability Age Under 5
In terms of disability age under 5, the demographic groups most similar to Indians (Asian) are Yakama (1.00%, a difference of 0.28%), Immigrants from Micronesia (1.0%, a difference of 0.31%), Immigrants from Iran (1.00%, a difference of 0.36%), Immigrants from Taiwan (1.0%, a difference of 0.43%), and British West Indian (0.99%, a difference of 1.1%). Similarly, the demographic groups most similar to Immigrants from Guyana are Immigrants from India (1.0%, a difference of 0.080%), Immigrants from Nepal (1.0%, a difference of 0.11%), Filipino (1.1%, a difference of 0.67%), Barbadian (1.0%, a difference of 0.82%), and Immigrants from Albania (1.1%, a difference of 1.0%).
| Demographics | Rating | Rank | Disability Age Under 5 |
| British West Indians | 100.0 /100 | #21 | Exceptional 0.99% |
| Immigrants | Iran | 100.0 /100 | #22 | Exceptional 1.00% |
| Yakama | 100.0 /100 | #23 | Exceptional 1.00% |
| Indians (Asian) | 100.0 /100 | #24 | Exceptional 1.0% |
| Immigrants | Micronesia | 100.0 /100 | #25 | Exceptional 1.0% |
| Immigrants | Taiwan | 100.0 /100 | #26 | Exceptional 1.0% |
| Guyanese | 100.0 /100 | #27 | Exceptional 1.0% |
| Immigrants | Eastern Asia | 100.0 /100 | #28 | Exceptional 1.0% |
| Immigrants | Belarus | 100.0 /100 | #29 | Exceptional 1.0% |
| Immigrants | South Central Asia | 99.9 /100 | #30 | Exceptional 1.0% |
| Armenians | 99.9 /100 | #31 | Exceptional 1.0% |
| Iranians | 99.9 /100 | #32 | Exceptional 1.0% |
| Bolivians | 99.9 /100 | #33 | Exceptional 1.0% |
| Immigrants | Ukraine | 99.9 /100 | #34 | Exceptional 1.0% |
| Barbadians | 99.9 /100 | #35 | Exceptional 1.0% |
| Immigrants | Nepal | 99.9 /100 | #36 | Exceptional 1.0% |
| Immigrants | India | 99.9 /100 | #37 | Exceptional 1.0% |
| Immigrants | Guyana | 99.9 /100 | #38 | Exceptional 1.0% |
| Filipinos | 99.9 /100 | #39 | Exceptional 1.1% |
| Immigrants | Albania | 99.9 /100 | #40 | Exceptional 1.1% |
| Thais | 99.8 /100 | #41 | Exceptional 1.1% |