Maltese vs Immigrants from Bulgaria Ambulatory Disability
COMPARE
Maltese
Immigrants from Bulgaria
Ambulatory Disability
Ambulatory Disability Comparison
Maltese
Immigrants from Bulgaria
6.0%
AMBULATORY DISABILITY
81.6/ 100
METRIC RATING
150th/ 347
METRIC RANK
5.6%
AMBULATORY DISABILITY
99.8/ 100
METRIC RATING
55th/ 347
METRIC RANK
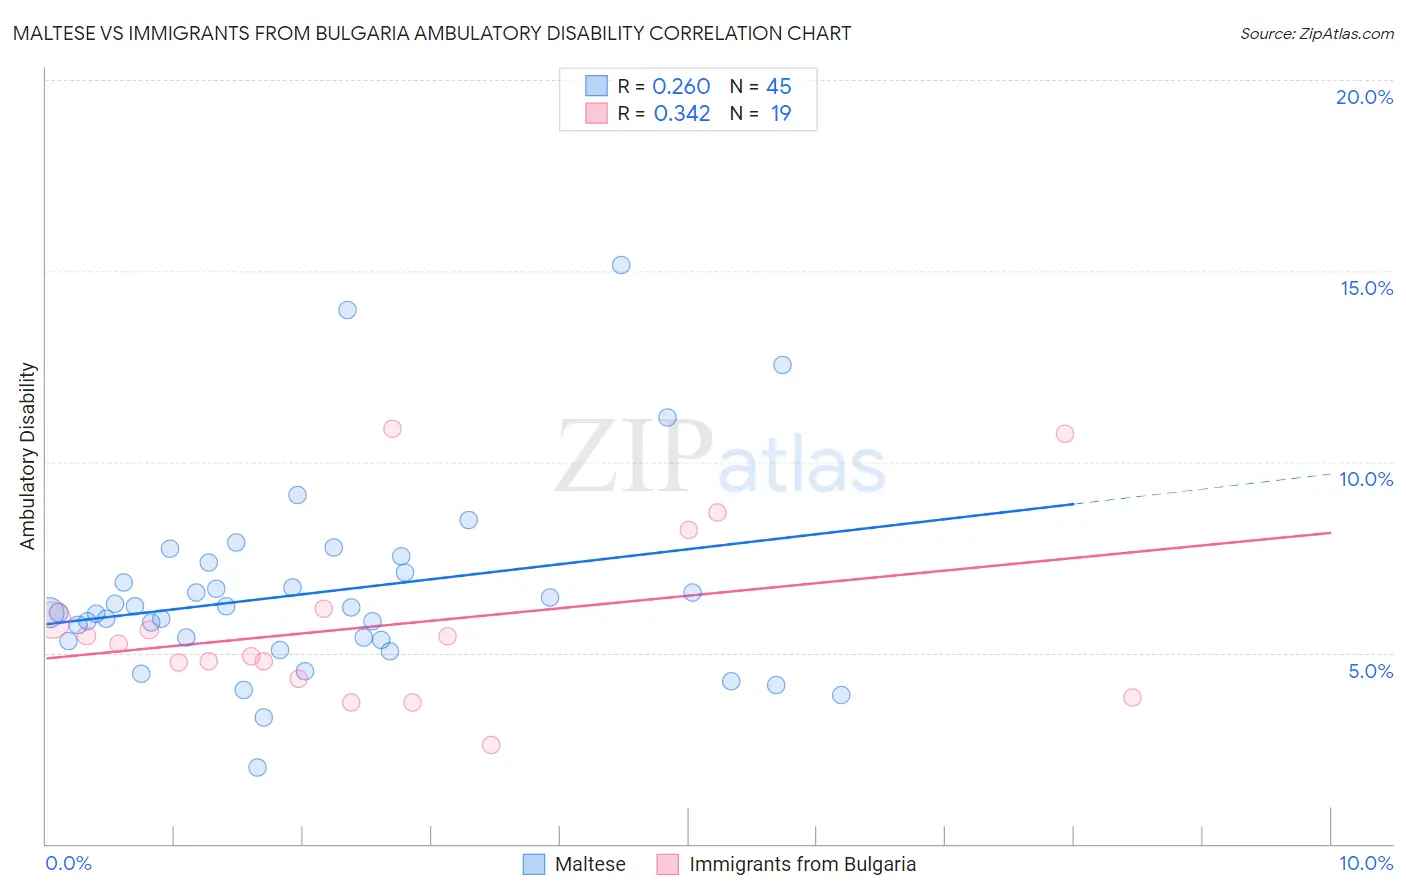
Maltese vs Immigrants from Bulgaria Ambulatory Disability Correlation Chart
The statistical analysis conducted on geographies consisting of 126,465,300 people shows a weak positive correlation between the proportion of Maltese and percentage of population with ambulatory disability in the United States with a correlation coefficient (R) of 0.260 and weighted average of 6.0%. Similarly, the statistical analysis conducted on geographies consisting of 172,546,961 people shows a mild positive correlation between the proportion of Immigrants from Bulgaria and percentage of population with ambulatory disability in the United States with a correlation coefficient (R) of 0.342 and weighted average of 5.6%, a difference of 7.0%.
Ambulatory Disability Correlation Summary
| Measurement | Maltese | Immigrants from Bulgaria |
| Minimum | 2.0% | 2.6% |
| Maximum | 15.2% | 10.9% |
| Range | 13.2% | 8.3% |
| Mean | 6.6% | 5.8% |
| Median | 6.1% | 5.2% |
| Interquartile 25% (IQ1) | 5.3% | 4.3% |
| Interquartile 75% (IQ3) | 7.2% | 6.1% |
| Interquartile Range (IQR) | 1.9% | 1.8% |
| Standard Deviation (Sample) | 2.5% | 2.3% |
| Standard Deviation (Population) | 2.5% | 2.2% |
Similar Demographics by Ambulatory Disability
Demographics Similar to Maltese by Ambulatory Disability
In terms of ambulatory disability, the demographic groups most similar to Maltese are Lithuanian (6.0%, a difference of 0.020%), Immigrants from Eastern Europe (6.0%, a difference of 0.030%), Immigrants from Moldova (6.0%, a difference of 0.070%), Pakistani (6.0%, a difference of 0.080%), and Immigrants from Greece (6.0%, a difference of 0.080%).
| Demographics | Rating | Rank | Ambulatory Disability |
| Romanians | 82.9 /100 | #143 | Excellent 6.0% |
| Macedonians | 82.8 /100 | #144 | Excellent 6.0% |
| Pakistanis | 82.5 /100 | #145 | Excellent 6.0% |
| Immigrants | Greece | 82.5 /100 | #146 | Excellent 6.0% |
| Immigrants | Moldova | 82.4 /100 | #147 | Excellent 6.0% |
| Immigrants | Eastern Europe | 82.0 /100 | #148 | Excellent 6.0% |
| Lithuanians | 81.9 /100 | #149 | Excellent 6.0% |
| Maltese | 81.6 /100 | #150 | Excellent 6.0% |
| Greeks | 79.6 /100 | #151 | Good 6.0% |
| Immigrants | Austria | 78.8 /100 | #152 | Good 6.0% |
| Syrians | 75.5 /100 | #153 | Good 6.0% |
| Immigrants | Croatia | 75.1 /100 | #154 | Good 6.0% |
| Immigrants | Scotland | 72.1 /100 | #155 | Good 6.0% |
| Northern Europeans | 71.8 /100 | #156 | Good 6.0% |
| Ghanaians | 71.3 /100 | #157 | Good 6.0% |
Demographics Similar to Immigrants from Bulgaria by Ambulatory Disability
In terms of ambulatory disability, the demographic groups most similar to Immigrants from Bulgaria are Immigrants from Eastern Africa (5.6%, a difference of 0.070%), Inupiat (5.6%, a difference of 0.090%), Immigrants from Egypt (5.6%, a difference of 0.11%), Jordanian (5.6%, a difference of 0.12%), and Taiwanese (5.6%, a difference of 0.21%).
| Demographics | Rating | Rank | Ambulatory Disability |
| Immigrants | Argentina | 99.9 /100 | #48 | Exceptional 5.6% |
| Bulgarians | 99.9 /100 | #49 | Exceptional 5.6% |
| Luxembourgers | 99.9 /100 | #50 | Exceptional 5.6% |
| Taiwanese | 99.8 /100 | #51 | Exceptional 5.6% |
| Jordanians | 99.8 /100 | #52 | Exceptional 5.6% |
| Immigrants | Egypt | 99.8 /100 | #53 | Exceptional 5.6% |
| Immigrants | Eastern Africa | 99.8 /100 | #54 | Exceptional 5.6% |
| Immigrants | Bulgaria | 99.8 /100 | #55 | Exceptional 5.6% |
| Inupiat | 99.8 /100 | #56 | Exceptional 5.6% |
| Immigrants | Brazil | 99.8 /100 | #57 | Exceptional 5.6% |
| Immigrants | Zimbabwe | 99.8 /100 | #58 | Exceptional 5.6% |
| Immigrants | Afghanistan | 99.8 /100 | #59 | Exceptional 5.6% |
| Immigrants | Lithuania | 99.8 /100 | #60 | Exceptional 5.6% |
| Immigrants | Belgium | 99.7 /100 | #61 | Exceptional 5.6% |
| Immigrants | Spain | 99.7 /100 | #62 | Exceptional 5.6% |