Maltese vs Scotch-Irish Male Disability
COMPARE
Maltese
Scotch-Irish
Male Disability
Male Disability Comparison
Maltese
Scotch-Irish
11.2%
MALE DISABILITY
50.0/ 100
METRIC RATING
174th/ 347
METRIC RANK
13.2%
MALE DISABILITY
0.0/ 100
METRIC RATING
303rd/ 347
METRIC RANK
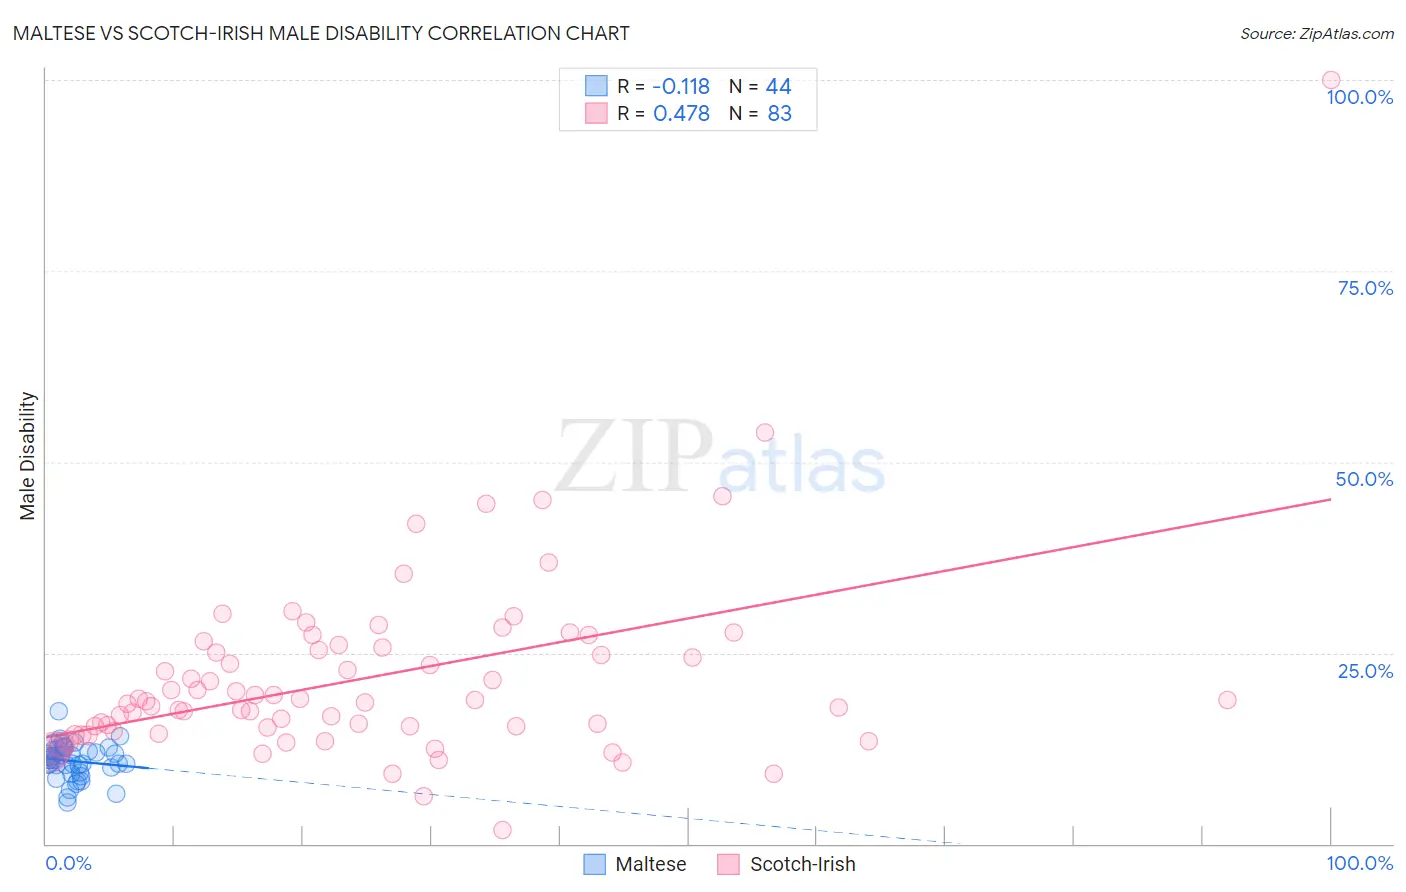
Maltese vs Scotch-Irish Male Disability Correlation Chart
The statistical analysis conducted on geographies consisting of 126,476,999 people shows a poor negative correlation between the proportion of Maltese and percentage of males with a disability in the United States with a correlation coefficient (R) of -0.118 and weighted average of 11.2%. Similarly, the statistical analysis conducted on geographies consisting of 548,574,277 people shows a moderate positive correlation between the proportion of Scotch-Irish and percentage of males with a disability in the United States with a correlation coefficient (R) of 0.478 and weighted average of 13.2%, a difference of 17.6%.
Male Disability Correlation Summary
| Measurement | Maltese | Scotch-Irish |
| Minimum | 5.3% | 1.8% |
| Maximum | 17.4% | 100.0% |
| Range | 12.1% | 98.2% |
| Mean | 10.8% | 21.6% |
| Median | 11.0% | 18.6% |
| Interquartile 25% (IQ1) | 9.6% | 14.8% |
| Interquartile 75% (IQ3) | 12.4% | 25.6% |
| Interquartile Range (IQR) | 2.8% | 10.9% |
| Standard Deviation (Sample) | 2.3% | 12.6% |
| Standard Deviation (Population) | 2.3% | 12.6% |
Similar Demographics by Male Disability
Demographics Similar to Maltese by Male Disability
In terms of male disability, the demographic groups most similar to Maltese are Immigrants from Burma/Myanmar (11.2%, a difference of 0.020%), Romanian (11.2%, a difference of 0.040%), Immigrants from Honduras (11.2%, a difference of 0.070%), Haitian (11.2%, a difference of 0.14%), and New Zealander (11.2%, a difference of 0.16%).
| Demographics | Rating | Rank | Male Disability |
| Immigrants | Southern Europe | 54.4 /100 | #167 | Average 11.2% |
| Immigrants | Latin America | 54.0 /100 | #168 | Average 11.2% |
| Barbadians | 53.4 /100 | #169 | Average 11.2% |
| New Zealanders | 52.9 /100 | #170 | Average 11.2% |
| Haitians | 52.5 /100 | #171 | Average 11.2% |
| Romanians | 50.7 /100 | #172 | Average 11.2% |
| Immigrants | Burma/Myanmar | 50.4 /100 | #173 | Average 11.2% |
| Maltese | 50.0 /100 | #174 | Average 11.2% |
| Immigrants | Honduras | 48.7 /100 | #175 | Average 11.2% |
| Syrians | 46.6 /100 | #176 | Average 11.2% |
| Immigrants | Norway | 44.2 /100 | #177 | Average 11.3% |
| Australians | 42.2 /100 | #178 | Average 11.3% |
| Immigrants | Caribbean | 41.4 /100 | #179 | Average 11.3% |
| Hondurans | 41.1 /100 | #180 | Average 11.3% |
| Immigrants | Senegal | 34.4 /100 | #181 | Fair 11.3% |
Demographics Similar to Scotch-Irish by Male Disability
In terms of male disability, the demographic groups most similar to Scotch-Irish are Black/African American (13.2%, a difference of 0.32%), Crow (13.1%, a difference of 0.54%), French Canadian (13.3%, a difference of 0.74%), Spanish American (13.3%, a difference of 0.94%), and French (13.0%, a difference of 1.1%).
| Demographics | Rating | Rank | Male Disability |
| Immigrants | Nonimmigrants | 0.0 /100 | #296 | Tragic 12.9% |
| Inupiat | 0.0 /100 | #297 | Tragic 13.0% |
| Pennsylvania Germans | 0.0 /100 | #298 | Tragic 13.0% |
| Celtics | 0.0 /100 | #299 | Tragic 13.0% |
| Cheyenne | 0.0 /100 | #300 | Tragic 13.0% |
| French | 0.0 /100 | #301 | Tragic 13.0% |
| Crow | 0.0 /100 | #302 | Tragic 13.1% |
| Scotch-Irish | 0.0 /100 | #303 | Tragic 13.2% |
| Blacks/African Americans | 0.0 /100 | #304 | Tragic 13.2% |
| French Canadians | 0.0 /100 | #305 | Tragic 13.3% |
| Spanish Americans | 0.0 /100 | #306 | Tragic 13.3% |
| Arapaho | 0.0 /100 | #307 | Tragic 13.3% |
| French American Indians | 0.0 /100 | #308 | Tragic 13.4% |
| Blackfeet | 0.0 /100 | #309 | Tragic 13.4% |
| Immigrants | Azores | 0.0 /100 | #310 | Tragic 13.4% |