Maltese vs Northern European Male Disability
COMPARE
Maltese
Northern European
Male Disability
Male Disability Comparison
Maltese
Northern Europeans
11.2%
MALE DISABILITY
50.0/ 100
METRIC RATING
174th/ 347
METRIC RANK
11.9%
MALE DISABILITY
1.1/ 100
METRIC RATING
242nd/ 347
METRIC RANK
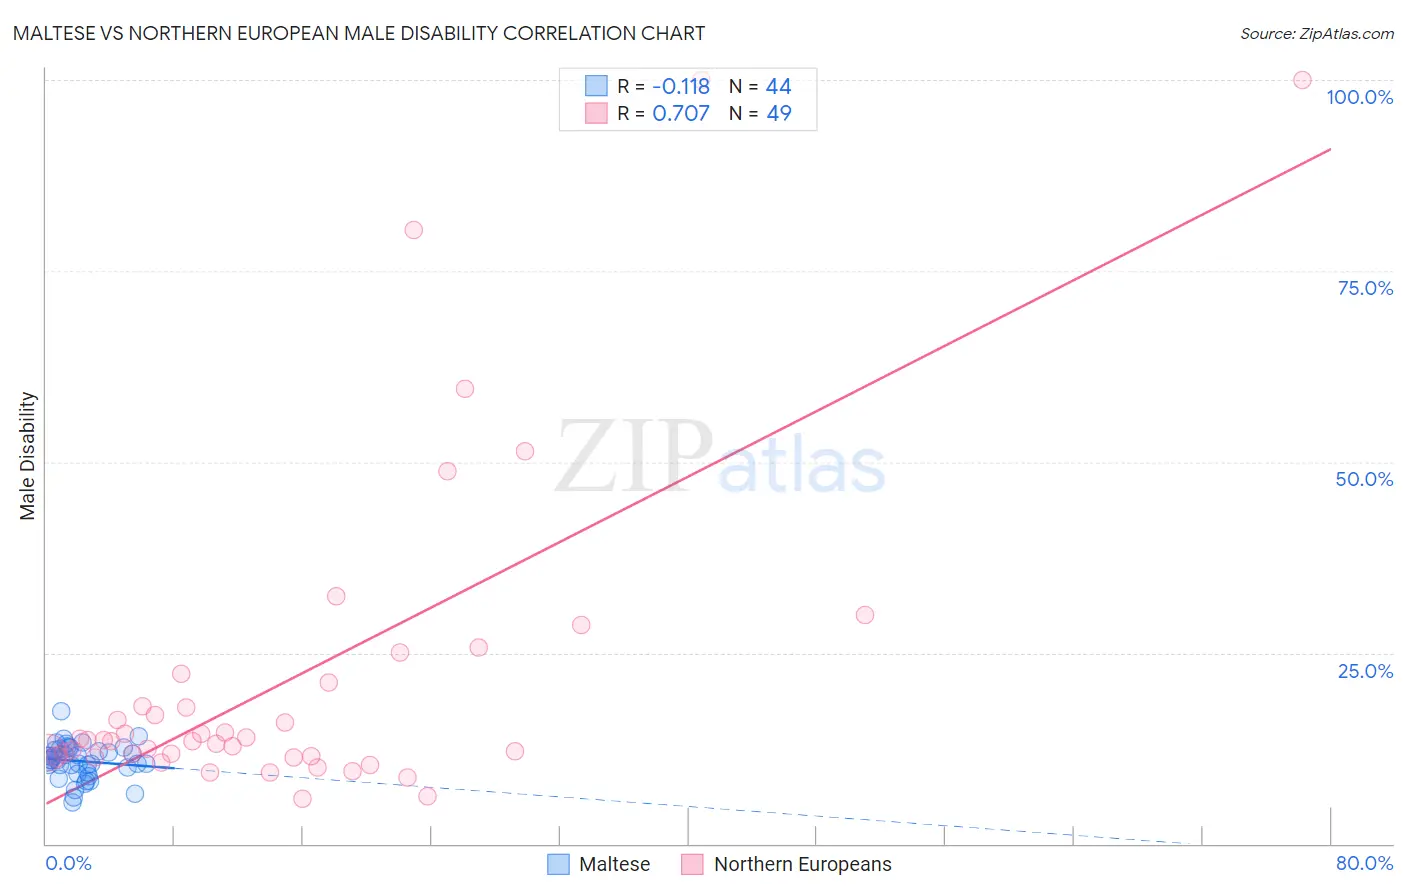
Maltese vs Northern European Male Disability Correlation Chart
The statistical analysis conducted on geographies consisting of 126,476,999 people shows a poor negative correlation between the proportion of Maltese and percentage of males with a disability in the United States with a correlation coefficient (R) of -0.118 and weighted average of 11.2%. Similarly, the statistical analysis conducted on geographies consisting of 406,040,370 people shows a strong positive correlation between the proportion of Northern Europeans and percentage of males with a disability in the United States with a correlation coefficient (R) of 0.707 and weighted average of 11.9%, a difference of 6.2%.
Male Disability Correlation Summary
| Measurement | Maltese | Northern European |
| Minimum | 5.3% | 5.8% |
| Maximum | 17.4% | 100.0% |
| Range | 12.1% | 94.2% |
| Mean | 10.8% | 21.8% |
| Median | 11.0% | 13.6% |
| Interquartile 25% (IQ1) | 9.6% | 11.5% |
| Interquartile 75% (IQ3) | 12.4% | 21.7% |
| Interquartile Range (IQR) | 2.8% | 10.3% |
| Standard Deviation (Sample) | 2.3% | 21.6% |
| Standard Deviation (Population) | 2.3% | 21.4% |
Similar Demographics by Male Disability
Demographics Similar to Maltese by Male Disability
In terms of male disability, the demographic groups most similar to Maltese are Immigrants from Burma/Myanmar (11.2%, a difference of 0.020%), Romanian (11.2%, a difference of 0.040%), Immigrants from Honduras (11.2%, a difference of 0.070%), Haitian (11.2%, a difference of 0.14%), and New Zealander (11.2%, a difference of 0.16%).
| Demographics | Rating | Rank | Male Disability |
| Immigrants | Southern Europe | 54.4 /100 | #167 | Average 11.2% |
| Immigrants | Latin America | 54.0 /100 | #168 | Average 11.2% |
| Barbadians | 53.4 /100 | #169 | Average 11.2% |
| New Zealanders | 52.9 /100 | #170 | Average 11.2% |
| Haitians | 52.5 /100 | #171 | Average 11.2% |
| Romanians | 50.7 /100 | #172 | Average 11.2% |
| Immigrants | Burma/Myanmar | 50.4 /100 | #173 | Average 11.2% |
| Maltese | 50.0 /100 | #174 | Average 11.2% |
| Immigrants | Honduras | 48.7 /100 | #175 | Average 11.2% |
| Syrians | 46.6 /100 | #176 | Average 11.2% |
| Immigrants | Norway | 44.2 /100 | #177 | Average 11.3% |
| Australians | 42.2 /100 | #178 | Average 11.3% |
| Immigrants | Caribbean | 41.4 /100 | #179 | Average 11.3% |
| Hondurans | 41.1 /100 | #180 | Average 11.3% |
| Immigrants | Senegal | 34.4 /100 | #181 | Fair 11.3% |
Demographics Similar to Northern Europeans by Male Disability
In terms of male disability, the demographic groups most similar to Northern Europeans are Bahamian (11.9%, a difference of 0.010%), Samoan (11.9%, a difference of 0.030%), Czech (11.9%, a difference of 0.050%), Italian (11.9%, a difference of 0.10%), and Immigrants from Laos (11.9%, a difference of 0.14%).
| Demographics | Rating | Rank | Male Disability |
| Immigrants | North America | 1.5 /100 | #235 | Tragic 11.9% |
| U.S. Virgin Islanders | 1.3 /100 | #236 | Tragic 11.9% |
| Carpatho Rusyns | 1.3 /100 | #237 | Tragic 11.9% |
| Yugoslavians | 1.2 /100 | #238 | Tragic 11.9% |
| Italians | 1.2 /100 | #239 | Tragic 11.9% |
| Czechs | 1.1 /100 | #240 | Tragic 11.9% |
| Bahamians | 1.1 /100 | #241 | Tragic 11.9% |
| Northern Europeans | 1.1 /100 | #242 | Tragic 11.9% |
| Samoans | 1.1 /100 | #243 | Tragic 11.9% |
| Immigrants | Laos | 1.0 /100 | #244 | Tragic 11.9% |
| Immigrants | Liberia | 1.0 /100 | #245 | Tragic 11.9% |
| Danes | 0.9 /100 | #246 | Tragic 11.9% |
| Hungarians | 0.8 /100 | #247 | Tragic 12.0% |
| Poles | 0.7 /100 | #248 | Tragic 12.0% |
| Immigrants | Yemen | 0.5 /100 | #249 | Tragic 12.0% |