South African vs Austrian Self-Care Disability
COMPARE
South African
Austrian
Self-Care Disability
Self-Care Disability Comparison
South Africans
Austrians
2.3%
SELF-CARE DISABILITY
99.3/ 100
METRIC RATING
67th/ 347
METRIC RANK
2.4%
SELF-CARE DISABILITY
87.0/ 100
METRIC RATING
137th/ 347
METRIC RANK
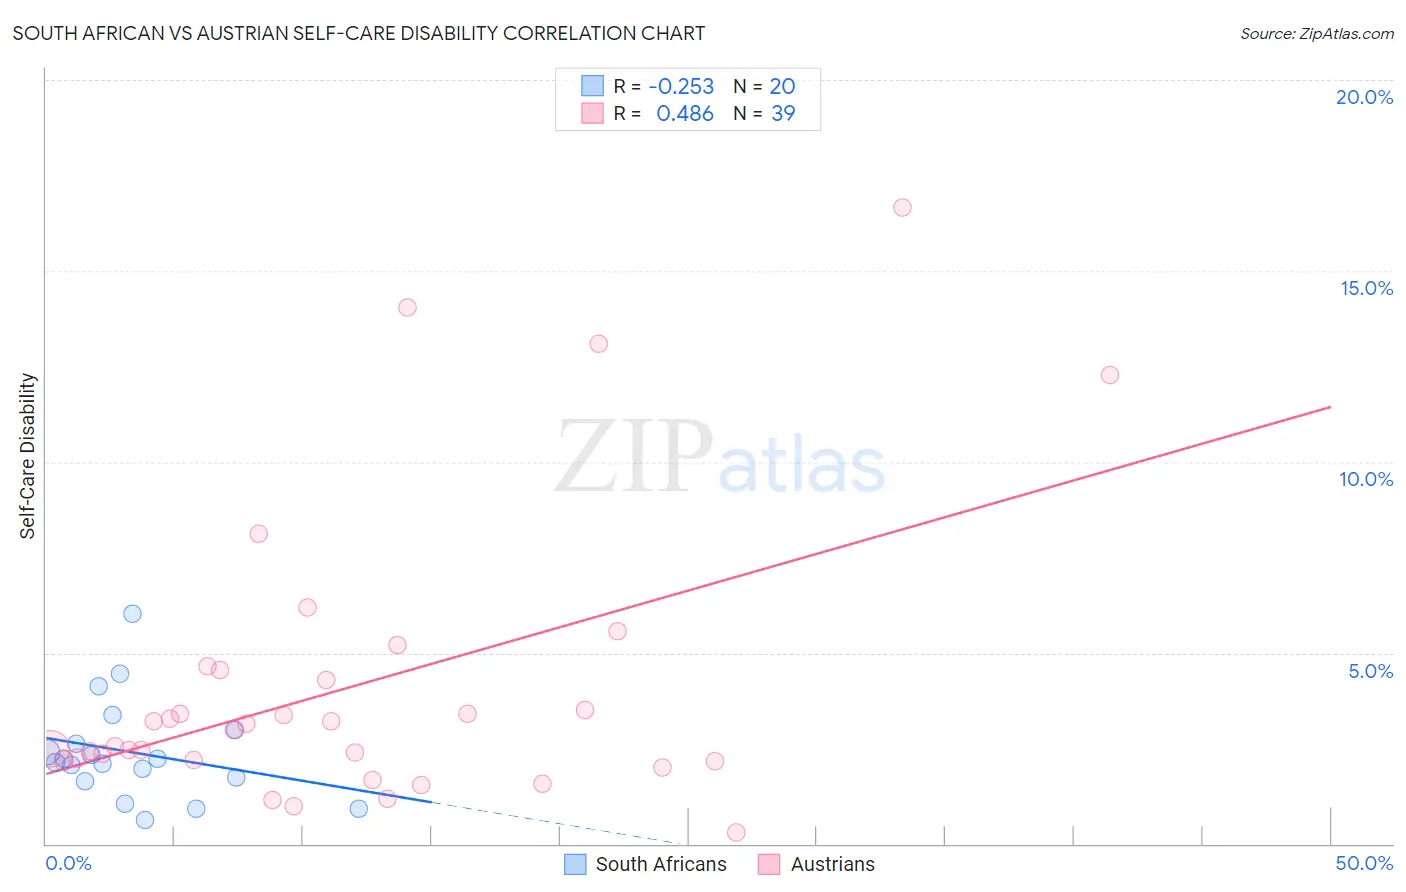
South African vs Austrian Self-Care Disability Correlation Chart
The statistical analysis conducted on geographies consisting of 182,494,090 people shows a weak negative correlation between the proportion of South Africans and percentage of population with self-care disability in the United States with a correlation coefficient (R) of -0.253 and weighted average of 2.3%. Similarly, the statistical analysis conducted on geographies consisting of 451,319,038 people shows a moderate positive correlation between the proportion of Austrians and percentage of population with self-care disability in the United States with a correlation coefficient (R) of 0.486 and weighted average of 2.4%, a difference of 3.8%.
Self-Care Disability Correlation Summary
| Measurement | South African | Austrian |
| Minimum | 0.63% | 0.31% |
| Maximum | 6.0% | 16.7% |
| Range | 5.4% | 16.4% |
| Mean | 2.4% | 4.1% |
| Median | 2.2% | 3.0% |
| Interquartile 25% (IQ1) | 1.7% | 2.2% |
| Interquartile 75% (IQ3) | 2.8% | 4.6% |
| Interquartile Range (IQR) | 1.1% | 2.4% |
| Standard Deviation (Sample) | 1.3% | 3.7% |
| Standard Deviation (Population) | 1.3% | 3.7% |
Similar Demographics by Self-Care Disability
Demographics Similar to South Africans by Self-Care Disability
In terms of self-care disability, the demographic groups most similar to South Africans are Immigrants from Argentina (2.3%, a difference of 0.030%), Brazilian (2.3%, a difference of 0.060%), Immigrants from Zaire (2.3%, a difference of 0.090%), Immigrants from Norway (2.3%, a difference of 0.090%), and Swedish (2.3%, a difference of 0.12%).
| Demographics | Rating | Rank | Self-Care Disability |
| Immigrants | Japan | 99.5 /100 | #60 | Exceptional 2.3% |
| Palestinians | 99.4 /100 | #61 | Exceptional 2.3% |
| Egyptians | 99.4 /100 | #62 | Exceptional 2.3% |
| Mongolians | 99.3 /100 | #63 | Exceptional 2.3% |
| Swedes | 99.3 /100 | #64 | Exceptional 2.3% |
| Brazilians | 99.3 /100 | #65 | Exceptional 2.3% |
| Immigrants | Argentina | 99.3 /100 | #66 | Exceptional 2.3% |
| South Africans | 99.3 /100 | #67 | Exceptional 2.3% |
| Immigrants | Zaire | 99.2 /100 | #68 | Exceptional 2.3% |
| Immigrants | Norway | 99.2 /100 | #69 | Exceptional 2.3% |
| Immigrants | Northern Europe | 99.2 /100 | #70 | Exceptional 2.3% |
| Asians | 99.2 /100 | #71 | Exceptional 2.3% |
| Eastern Europeans | 99.2 /100 | #72 | Exceptional 2.3% |
| Immigrants | Egypt | 99.1 /100 | #73 | Exceptional 2.3% |
| Immigrants | Switzerland | 99.1 /100 | #74 | Exceptional 2.3% |
Demographics Similar to Austrians by Self-Care Disability
In terms of self-care disability, the demographic groups most similar to Austrians are South American Indian (2.4%, a difference of 0.020%), Immigrants from Croatia (2.4%, a difference of 0.050%), Sri Lankan (2.4%, a difference of 0.050%), Laotian (2.4%, a difference of 0.080%), and Russian (2.4%, a difference of 0.14%).
| Demographics | Rating | Rank | Self-Care Disability |
| Immigrants | Austria | 89.0 /100 | #130 | Excellent 2.4% |
| Poles | 88.9 /100 | #131 | Excellent 2.4% |
| Immigrants | South America | 88.8 /100 | #132 | Excellent 2.4% |
| Immigrants | Colombia | 88.5 /100 | #133 | Excellent 2.4% |
| Russians | 88.2 /100 | #134 | Excellent 2.4% |
| Laotians | 87.8 /100 | #135 | Excellent 2.4% |
| South American Indians | 87.2 /100 | #136 | Excellent 2.4% |
| Austrians | 87.0 /100 | #137 | Excellent 2.4% |
| Immigrants | Croatia | 86.6 /100 | #138 | Excellent 2.4% |
| Sri Lankans | 86.6 /100 | #139 | Excellent 2.4% |
| Immigrants | Uruguay | 85.4 /100 | #140 | Excellent 2.4% |
| Alaska Natives | 84.5 /100 | #141 | Excellent 2.4% |
| Immigrants | Peru | 83.2 /100 | #142 | Excellent 2.4% |
| Afghans | 82.3 /100 | #143 | Excellent 2.4% |
| Costa Ricans | 80.8 /100 | #144 | Excellent 2.4% |