Japanese vs Immigrants from Serbia Cognitive Disability
COMPARE
Japanese
Immigrants from Serbia
Cognitive Disability
Cognitive Disability Comparison
Japanese
Immigrants from Serbia
18.3%
COGNITIVE DISABILITY
0.0/ 100
METRIC RATING
298th/ 347
METRIC RANK
16.7%
COGNITIVE DISABILITY
99.3/ 100
METRIC RATING
76th/ 347
METRIC RANK
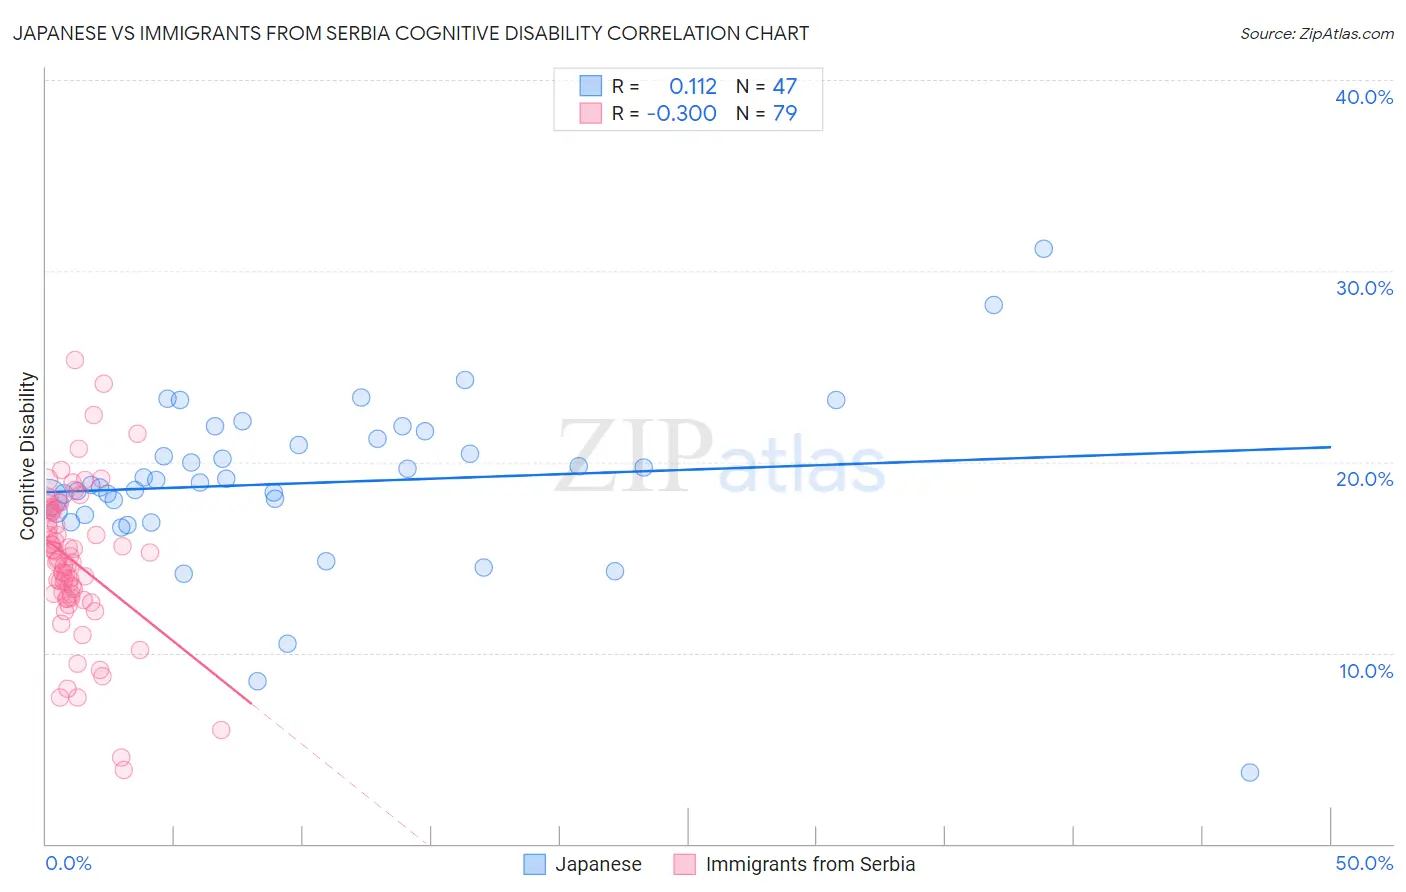
Japanese vs Immigrants from Serbia Cognitive Disability Correlation Chart
The statistical analysis conducted on geographies consisting of 249,155,070 people shows a poor positive correlation between the proportion of Japanese and percentage of population with cognitive disability in the United States with a correlation coefficient (R) of 0.112 and weighted average of 18.3%. Similarly, the statistical analysis conducted on geographies consisting of 131,747,829 people shows a mild negative correlation between the proportion of Immigrants from Serbia and percentage of population with cognitive disability in the United States with a correlation coefficient (R) of -0.300 and weighted average of 16.7%, a difference of 9.5%.
Cognitive Disability Correlation Summary
| Measurement | Japanese | Immigrants from Serbia |
| Minimum | 3.7% | 3.9% |
| Maximum | 31.2% | 25.3% |
| Range | 27.4% | 21.5% |
| Mean | 18.9% | 14.8% |
| Median | 18.9% | 14.9% |
| Interquartile 25% (IQ1) | 17.2% | 12.9% |
| Interquartile 75% (IQ3) | 21.2% | 17.4% |
| Interquartile Range (IQR) | 4.0% | 4.5% |
| Standard Deviation (Sample) | 4.5% | 3.9% |
| Standard Deviation (Population) | 4.4% | 3.9% |
Similar Demographics by Cognitive Disability
Demographics Similar to Japanese by Cognitive Disability
In terms of cognitive disability, the demographic groups most similar to Japanese are Blackfeet (18.3%, a difference of 0.0%), Ghanaian (18.3%, a difference of 0.030%), Creek (18.3%, a difference of 0.060%), Immigrants from Burma/Myanmar (18.2%, a difference of 0.14%), and German Russian (18.2%, a difference of 0.17%).
| Demographics | Rating | Rank | Cognitive Disability |
| Ottawa | 0.1 /100 | #291 | Tragic 18.2% |
| Iroquois | 0.1 /100 | #292 | Tragic 18.2% |
| Central American Indians | 0.1 /100 | #293 | Tragic 18.2% |
| British West Indians | 0.1 /100 | #294 | Tragic 18.2% |
| German Russians | 0.0 /100 | #295 | Tragic 18.2% |
| Immigrants | Burma/Myanmar | 0.0 /100 | #296 | Tragic 18.2% |
| Blackfeet | 0.0 /100 | #297 | Tragic 18.3% |
| Japanese | 0.0 /100 | #298 | Tragic 18.3% |
| Ghanaians | 0.0 /100 | #299 | Tragic 18.3% |
| Creek | 0.0 /100 | #300 | Tragic 18.3% |
| Immigrants | Ghana | 0.0 /100 | #301 | Tragic 18.3% |
| Barbadians | 0.0 /100 | #302 | Tragic 18.3% |
| Immigrants | Kenya | 0.0 /100 | #303 | Tragic 18.3% |
| Immigrants | Eritrea | 0.0 /100 | #304 | Tragic 18.3% |
| Colville | 0.0 /100 | #305 | Tragic 18.3% |
Demographics Similar to Immigrants from Serbia by Cognitive Disability
In terms of cognitive disability, the demographic groups most similar to Immigrants from Serbia are Immigrants from Hungary (16.7%, a difference of 0.010%), Peruvian (16.7%, a difference of 0.010%), Estonian (16.7%, a difference of 0.020%), Immigrants from Bulgaria (16.7%, a difference of 0.020%), and Burmese (16.7%, a difference of 0.030%).
| Demographics | Rating | Rank | Cognitive Disability |
| Immigrants | Uzbekistan | 99.4 /100 | #69 | Exceptional 16.7% |
| Immigrants | Sweden | 99.4 /100 | #70 | Exceptional 16.7% |
| Immigrants | Belgium | 99.3 /100 | #71 | Exceptional 16.7% |
| Germans | 99.3 /100 | #72 | Exceptional 16.7% |
| Burmese | 99.3 /100 | #73 | Exceptional 16.7% |
| Slavs | 99.3 /100 | #74 | Exceptional 16.7% |
| Estonians | 99.3 /100 | #75 | Exceptional 16.7% |
| Immigrants | Serbia | 99.3 /100 | #76 | Exceptional 16.7% |
| Immigrants | Hungary | 99.3 /100 | #77 | Exceptional 16.7% |
| Peruvians | 99.3 /100 | #78 | Exceptional 16.7% |
| Immigrants | Bulgaria | 99.3 /100 | #79 | Exceptional 16.7% |
| Egyptians | 99.2 /100 | #80 | Exceptional 16.7% |
| Immigrants | Netherlands | 99.2 /100 | #81 | Exceptional 16.7% |
| Swiss | 99.2 /100 | #82 | Exceptional 16.7% |
| Serbians | 99.1 /100 | #83 | Exceptional 16.7% |