Malaysian vs Immigrants from Japan Cognitive Disability
COMPARE
Malaysian
Immigrants from Japan
Cognitive Disability
Cognitive Disability Comparison
Malaysians
Immigrants from Japan
17.9%
COGNITIVE DISABILITY
0.6/ 100
METRIC RATING
251st/ 347
METRIC RANK
16.9%
COGNITIVE DISABILITY
96.2/ 100
METRIC RATING
117th/ 347
METRIC RANK
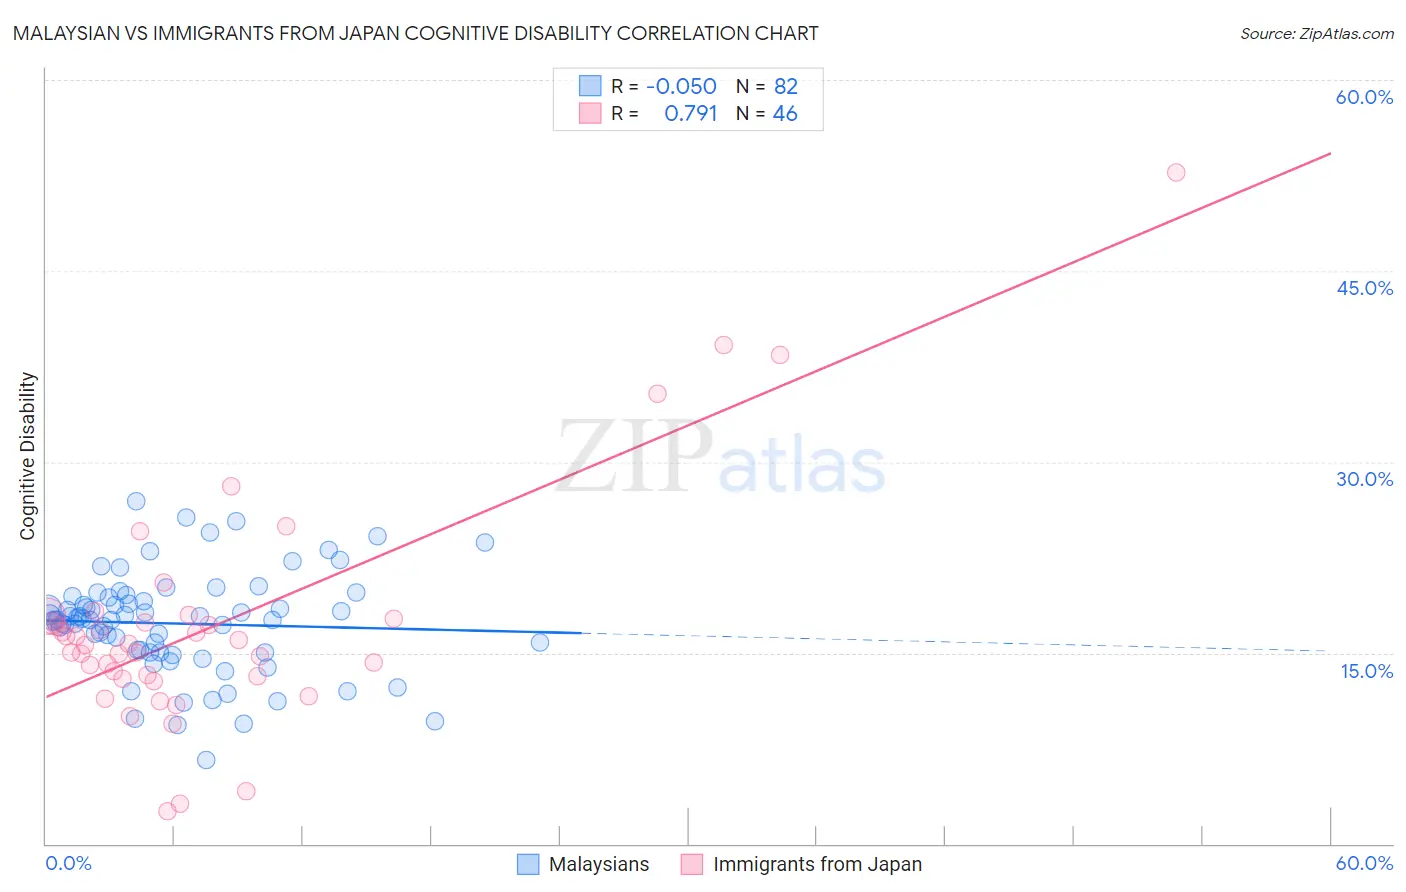
Malaysian vs Immigrants from Japan Cognitive Disability Correlation Chart
The statistical analysis conducted on geographies consisting of 226,070,316 people shows a slight negative correlation between the proportion of Malaysians and percentage of population with cognitive disability in the United States with a correlation coefficient (R) of -0.050 and weighted average of 17.9%. Similarly, the statistical analysis conducted on geographies consisting of 340,148,832 people shows a strong positive correlation between the proportion of Immigrants from Japan and percentage of population with cognitive disability in the United States with a correlation coefficient (R) of 0.791 and weighted average of 16.9%, a difference of 6.0%.
Cognitive Disability Correlation Summary
| Measurement | Malaysian | Immigrants from Japan |
| Minimum | 6.6% | 2.6% |
| Maximum | 26.9% | 52.8% |
| Range | 20.3% | 50.2% |
| Mean | 17.3% | 17.2% |
| Median | 17.6% | 15.7% |
| Interquartile 25% (IQ1) | 15.0% | 13.1% |
| Interquartile 75% (IQ3) | 19.3% | 17.7% |
| Interquartile Range (IQR) | 4.3% | 4.6% |
| Standard Deviation (Sample) | 4.0% | 9.1% |
| Standard Deviation (Population) | 3.9% | 9.0% |
Similar Demographics by Cognitive Disability
Demographics Similar to Malaysians by Cognitive Disability
In terms of cognitive disability, the demographic groups most similar to Malaysians are Cree (17.9%, a difference of 0.010%), Immigrants from Ethiopia (17.9%, a difference of 0.010%), Immigrants from Grenada (17.9%, a difference of 0.010%), Hopi (17.9%, a difference of 0.030%), and Hispanic or Latino (17.9%, a difference of 0.030%).
| Demographics | Rating | Rank | Cognitive Disability |
| Jamaicans | 0.9 /100 | #244 | Tragic 17.9% |
| Trinidadians and Tobagonians | 0.8 /100 | #245 | Tragic 17.9% |
| Immigrants | Thailand | 0.8 /100 | #246 | Tragic 17.9% |
| Samoans | 0.7 /100 | #247 | Tragic 17.9% |
| French American Indians | 0.7 /100 | #248 | Tragic 17.9% |
| Cree | 0.7 /100 | #249 | Tragic 17.9% |
| Immigrants | Ethiopia | 0.7 /100 | #250 | Tragic 17.9% |
| Malaysians | 0.6 /100 | #251 | Tragic 17.9% |
| Immigrants | Grenada | 0.6 /100 | #252 | Tragic 17.9% |
| Hopi | 0.6 /100 | #253 | Tragic 17.9% |
| Hispanics or Latinos | 0.6 /100 | #254 | Tragic 17.9% |
| Immigrants | Azores | 0.6 /100 | #255 | Tragic 17.9% |
| Bahamians | 0.6 /100 | #256 | Tragic 17.9% |
| Mexican American Indians | 0.6 /100 | #257 | Tragic 17.9% |
| Immigrants | Armenia | 0.6 /100 | #258 | Tragic 17.9% |
Demographics Similar to Immigrants from Japan by Cognitive Disability
In terms of cognitive disability, the demographic groups most similar to Immigrants from Japan are Immigrants from Denmark (16.9%, a difference of 0.010%), Inupiat (16.9%, a difference of 0.050%), South African (16.9%, a difference of 0.13%), Yup'ik (16.9%, a difference of 0.15%), and Korean (16.8%, a difference of 0.20%).
| Demographics | Rating | Rank | Cognitive Disability |
| Arapaho | 97.3 /100 | #110 | Exceptional 16.8% |
| Uruguayans | 97.2 /100 | #111 | Exceptional 16.8% |
| Indians (Asian) | 97.2 /100 | #112 | Exceptional 16.8% |
| Immigrants | Sri Lanka | 97.1 /100 | #113 | Exceptional 16.8% |
| Koreans | 97.1 /100 | #114 | Exceptional 16.8% |
| Yup'ik | 96.9 /100 | #115 | Exceptional 16.9% |
| Inupiat | 96.5 /100 | #116 | Exceptional 16.9% |
| Immigrants | Japan | 96.2 /100 | #117 | Exceptional 16.9% |
| Immigrants | Denmark | 96.2 /100 | #118 | Exceptional 16.9% |
| South Africans | 95.5 /100 | #119 | Exceptional 16.9% |
| Scottish | 95.0 /100 | #120 | Exceptional 16.9% |
| Immigrants | China | 94.9 /100 | #121 | Exceptional 16.9% |
| Immigrants | Western Europe | 94.8 /100 | #122 | Exceptional 16.9% |
| Portuguese | 94.7 /100 | #123 | Exceptional 16.9% |
| Turks | 94.5 /100 | #124 | Exceptional 16.9% |