Immigrants from South America vs Immigrants from Serbia Cognitive Disability
COMPARE
Immigrants from South America
Immigrants from Serbia
Cognitive Disability
Cognitive Disability Comparison
Immigrants from South America
Immigrants from Serbia
16.7%
COGNITIVE DISABILITY
98.8/ 100
METRIC RATING
92nd/ 347
METRIC RANK
16.7%
COGNITIVE DISABILITY
99.3/ 100
METRIC RATING
76th/ 347
METRIC RANK
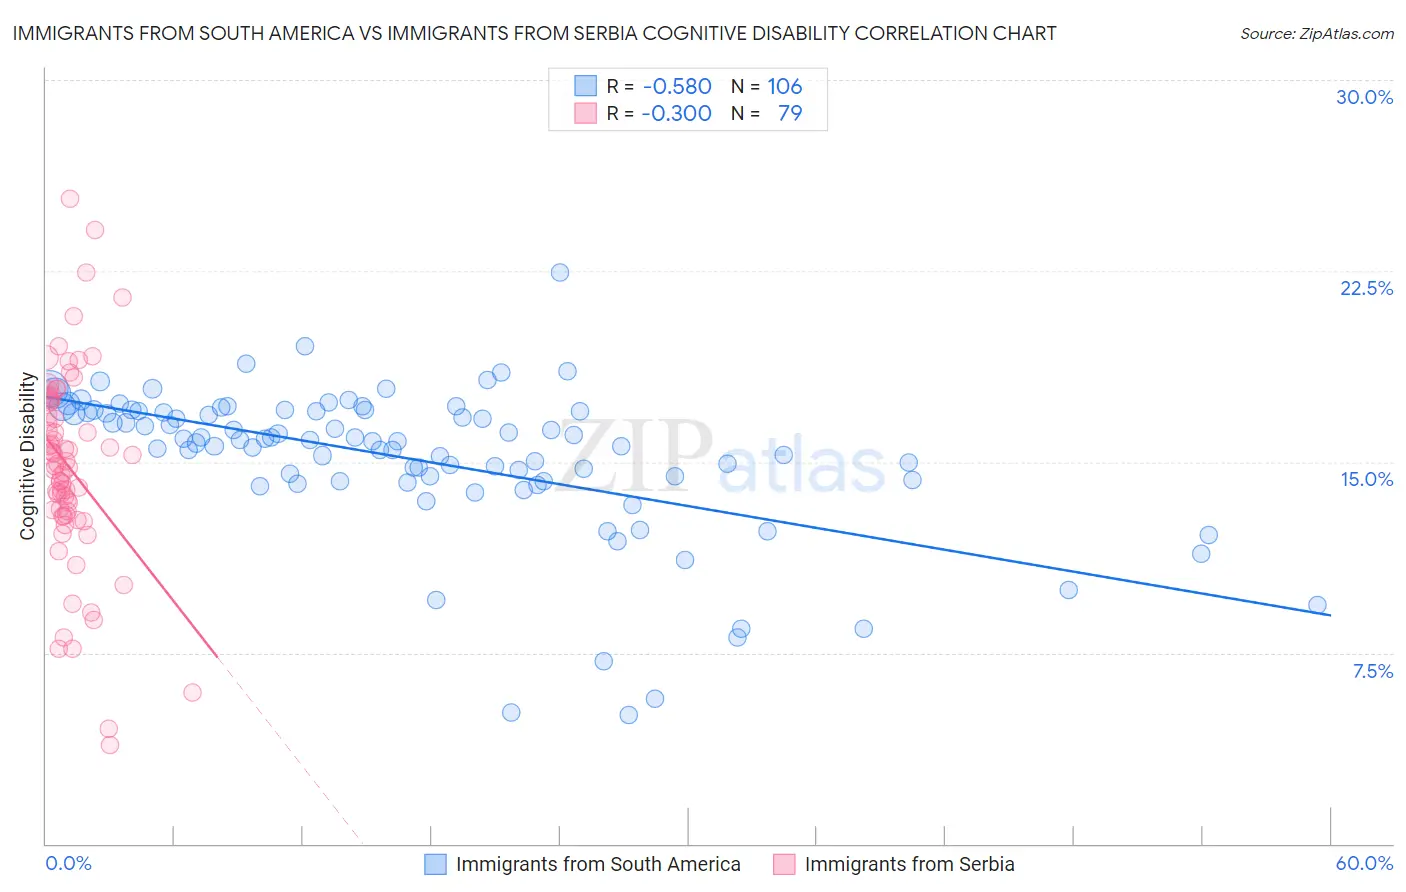
Immigrants from South America vs Immigrants from Serbia Cognitive Disability Correlation Chart
The statistical analysis conducted on geographies consisting of 486,335,122 people shows a substantial negative correlation between the proportion of Immigrants from South America and percentage of population with cognitive disability in the United States with a correlation coefficient (R) of -0.580 and weighted average of 16.7%. Similarly, the statistical analysis conducted on geographies consisting of 131,747,829 people shows a mild negative correlation between the proportion of Immigrants from Serbia and percentage of population with cognitive disability in the United States with a correlation coefficient (R) of -0.300 and weighted average of 16.7%, a difference of 0.42%.
Cognitive Disability Correlation Summary
| Measurement | Immigrants from South America | Immigrants from Serbia |
| Minimum | 5.1% | 3.9% |
| Maximum | 22.5% | 25.3% |
| Range | 17.4% | 21.5% |
| Mean | 15.1% | 14.8% |
| Median | 15.8% | 14.9% |
| Interquartile 25% (IQ1) | 14.2% | 12.9% |
| Interquartile 75% (IQ3) | 17.0% | 17.4% |
| Interquartile Range (IQR) | 2.8% | 4.5% |
| Standard Deviation (Sample) | 3.0% | 3.9% |
| Standard Deviation (Population) | 3.0% | 3.9% |
Demographics Similar to Immigrants from South America and Immigrants from Serbia by Cognitive Disability
In terms of cognitive disability, the demographic groups most similar to Immigrants from South America are Immigrants from Southern Europe (16.7%, a difference of 0.0%), Danish (16.7%, a difference of 0.010%), Immigrants from Egypt (16.7%, a difference of 0.020%), South American (16.7%, a difference of 0.020%), and Asian (16.7%, a difference of 0.050%). Similarly, the demographic groups most similar to Immigrants from Serbia are Immigrants from Hungary (16.7%, a difference of 0.010%), Peruvian (16.7%, a difference of 0.010%), Estonian (16.7%, a difference of 0.020%), Immigrants from Bulgaria (16.7%, a difference of 0.020%), and Slavic (16.7%, a difference of 0.030%).
| Demographics | Rating | Rank | Cognitive Disability |
| Slavs | 99.3 /100 | #74 | Exceptional 16.7% |
| Estonians | 99.3 /100 | #75 | Exceptional 16.7% |
| Immigrants | Serbia | 99.3 /100 | #76 | Exceptional 16.7% |
| Immigrants | Hungary | 99.3 /100 | #77 | Exceptional 16.7% |
| Peruvians | 99.3 /100 | #78 | Exceptional 16.7% |
| Immigrants | Bulgaria | 99.3 /100 | #79 | Exceptional 16.7% |
| Egyptians | 99.2 /100 | #80 | Exceptional 16.7% |
| Immigrants | Netherlands | 99.2 /100 | #81 | Exceptional 16.7% |
| Swiss | 99.2 /100 | #82 | Exceptional 16.7% |
| Serbians | 99.1 /100 | #83 | Exceptional 16.7% |
| Belgians | 99.1 /100 | #84 | Exceptional 16.7% |
| Immigrants | Moldova | 99.1 /100 | #85 | Exceptional 16.7% |
| Immigrants | South Africa | 99.0 /100 | #86 | Exceptional 16.7% |
| Native Hawaiians | 99.0 /100 | #87 | Exceptional 16.7% |
| Immigrants | Philippines | 99.0 /100 | #88 | Exceptional 16.7% |
| Immigrants | Egypt | 98.8 /100 | #89 | Exceptional 16.7% |
| South Americans | 98.8 /100 | #90 | Exceptional 16.7% |
| Danes | 98.8 /100 | #91 | Exceptional 16.7% |
| Immigrants | South America | 98.8 /100 | #92 | Exceptional 16.7% |
| Immigrants | Southern Europe | 98.7 /100 | #93 | Exceptional 16.7% |
| Asians | 98.7 /100 | #94 | Exceptional 16.7% |