Malaysian vs Alaskan Athabascan Cognitive Disability
COMPARE
Malaysian
Alaskan Athabascan
Cognitive Disability
Cognitive Disability Comparison
Malaysians
Alaskan Athabascans
17.9%
COGNITIVE DISABILITY
0.6/ 100
METRIC RATING
251st/ 347
METRIC RANK
17.6%
COGNITIVE DISABILITY
6.9/ 100
METRIC RATING
215th/ 347
METRIC RANK
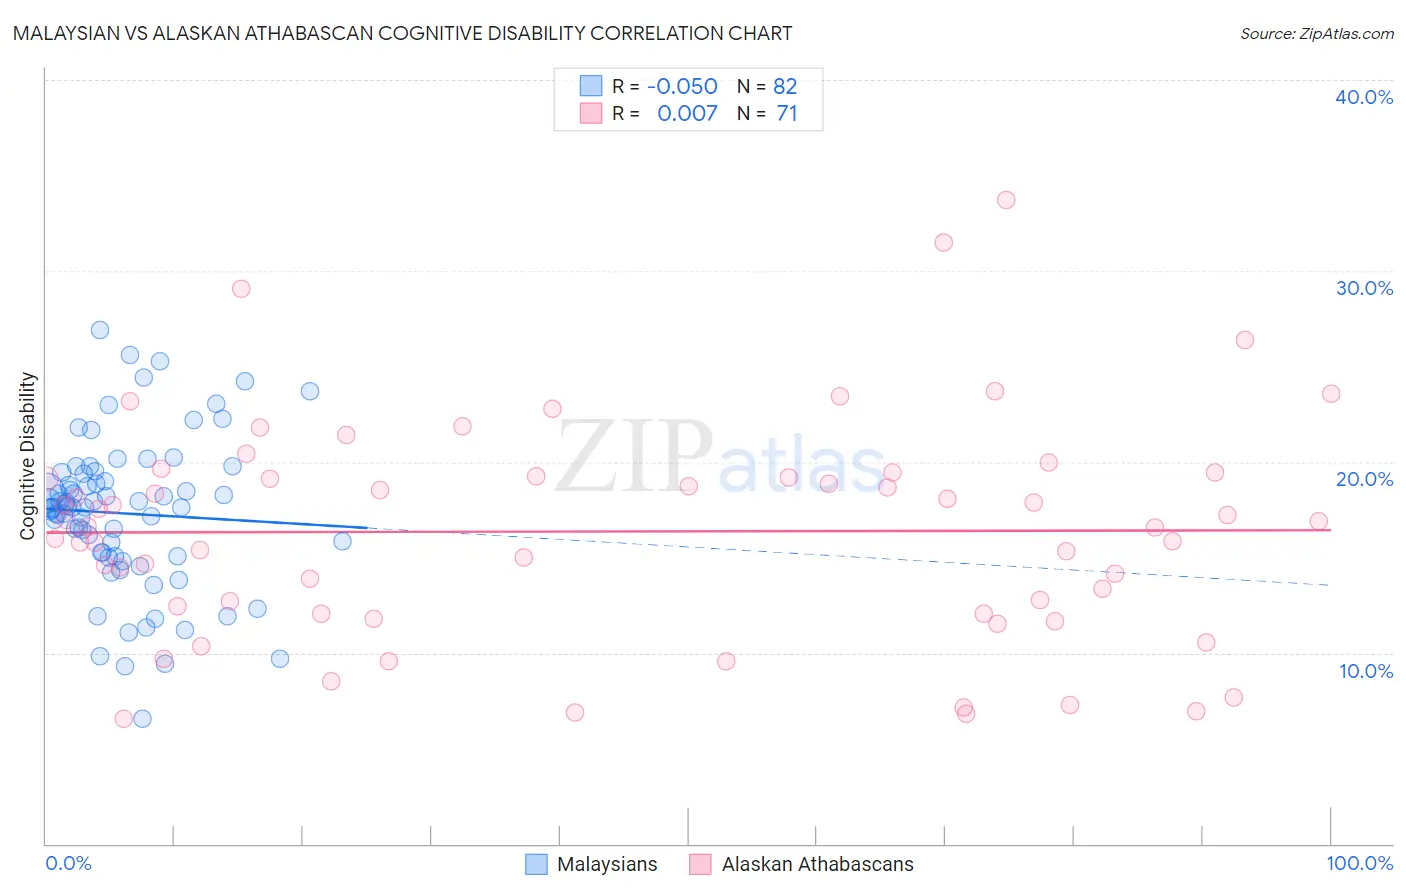
Malaysian vs Alaskan Athabascan Cognitive Disability Correlation Chart
The statistical analysis conducted on geographies consisting of 226,070,316 people shows a slight negative correlation between the proportion of Malaysians and percentage of population with cognitive disability in the United States with a correlation coefficient (R) of -0.050 and weighted average of 17.9%. Similarly, the statistical analysis conducted on geographies consisting of 45,820,962 people shows no correlation between the proportion of Alaskan Athabascans and percentage of population with cognitive disability in the United States with a correlation coefficient (R) of 0.007 and weighted average of 17.6%, a difference of 1.7%.
Cognitive Disability Correlation Summary
| Measurement | Malaysian | Alaskan Athabascan |
| Minimum | 6.6% | 6.5% |
| Maximum | 26.9% | 33.7% |
| Range | 20.3% | 27.2% |
| Mean | 17.3% | 16.4% |
| Median | 17.6% | 16.6% |
| Interquartile 25% (IQ1) | 15.0% | 12.1% |
| Interquartile 75% (IQ3) | 19.3% | 19.2% |
| Interquartile Range (IQR) | 4.3% | 7.2% |
| Standard Deviation (Sample) | 4.0% | 5.7% |
| Standard Deviation (Population) | 3.9% | 5.7% |
Similar Demographics by Cognitive Disability
Demographics Similar to Malaysians by Cognitive Disability
In terms of cognitive disability, the demographic groups most similar to Malaysians are Cree (17.9%, a difference of 0.010%), Immigrants from Ethiopia (17.9%, a difference of 0.010%), Immigrants from Grenada (17.9%, a difference of 0.010%), Hopi (17.9%, a difference of 0.030%), and Hispanic or Latino (17.9%, a difference of 0.030%).
| Demographics | Rating | Rank | Cognitive Disability |
| Jamaicans | 0.9 /100 | #244 | Tragic 17.9% |
| Trinidadians and Tobagonians | 0.8 /100 | #245 | Tragic 17.9% |
| Immigrants | Thailand | 0.8 /100 | #246 | Tragic 17.9% |
| Samoans | 0.7 /100 | #247 | Tragic 17.9% |
| French American Indians | 0.7 /100 | #248 | Tragic 17.9% |
| Cree | 0.7 /100 | #249 | Tragic 17.9% |
| Immigrants | Ethiopia | 0.7 /100 | #250 | Tragic 17.9% |
| Malaysians | 0.6 /100 | #251 | Tragic 17.9% |
| Immigrants | Grenada | 0.6 /100 | #252 | Tragic 17.9% |
| Hopi | 0.6 /100 | #253 | Tragic 17.9% |
| Hispanics or Latinos | 0.6 /100 | #254 | Tragic 17.9% |
| Immigrants | Azores | 0.6 /100 | #255 | Tragic 17.9% |
| Bahamians | 0.6 /100 | #256 | Tragic 17.9% |
| Mexican American Indians | 0.6 /100 | #257 | Tragic 17.9% |
| Immigrants | Armenia | 0.6 /100 | #258 | Tragic 17.9% |
Demographics Similar to Alaskan Athabascans by Cognitive Disability
In terms of cognitive disability, the demographic groups most similar to Alaskan Athabascans are Immigrants from El Salvador (17.6%, a difference of 0.010%), Okinawan (17.6%, a difference of 0.010%), Salvadoran (17.6%, a difference of 0.020%), Hawaiian (17.6%, a difference of 0.030%), and Immigrants from Oceania (17.6%, a difference of 0.050%).
| Demographics | Rating | Rank | Cognitive Disability |
| Immigrants | Cameroon | 9.3 /100 | #208 | Tragic 17.6% |
| Immigrants | Trinidad and Tobago | 8.7 /100 | #209 | Tragic 17.6% |
| Immigrants | Jamaica | 8.5 /100 | #210 | Tragic 17.6% |
| Taiwanese | 7.7 /100 | #211 | Tragic 17.6% |
| Immigrants | Oceania | 7.3 /100 | #212 | Tragic 17.6% |
| Hawaiians | 7.2 /100 | #213 | Tragic 17.6% |
| Immigrants | El Salvador | 7.0 /100 | #214 | Tragic 17.6% |
| Alaskan Athabascans | 6.9 /100 | #215 | Tragic 17.6% |
| Okinawans | 6.8 /100 | #216 | Tragic 17.6% |
| Salvadorans | 6.7 /100 | #217 | Tragic 17.6% |
| Icelanders | 6.4 /100 | #218 | Tragic 17.6% |
| Immigrants | Sierra Leone | 6.3 /100 | #219 | Tragic 17.6% |
| Zimbabweans | 6.1 /100 | #220 | Tragic 17.6% |
| Moroccans | 5.9 /100 | #221 | Tragic 17.6% |
| Central Americans | 4.5 /100 | #222 | Tragic 17.7% |