Macedonian vs Jordanian Female Disability
COMPARE
Macedonian
Jordanian
Female Disability
Female Disability Comparison
Macedonians
Jordanians
11.8%
FEMALE DISABILITY
95.5/ 100
METRIC RATING
129th/ 347
METRIC RANK
11.3%
FEMALE DISABILITY
100.0/ 100
METRIC RATING
47th/ 347
METRIC RANK
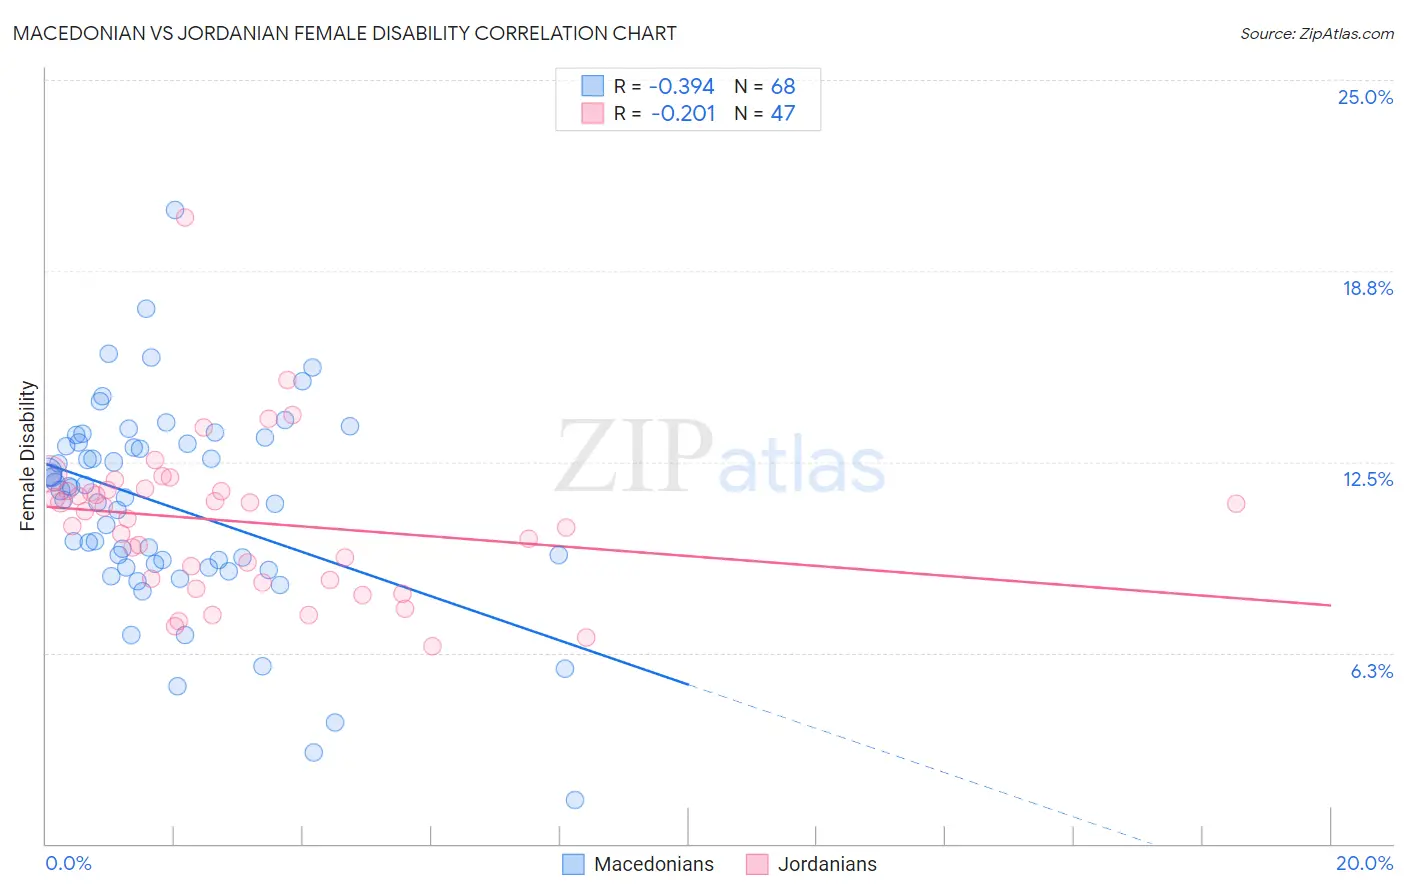
Macedonian vs Jordanian Female Disability Correlation Chart
The statistical analysis conducted on geographies consisting of 132,656,541 people shows a mild negative correlation between the proportion of Macedonians and percentage of females with a disability in the United States with a correlation coefficient (R) of -0.394 and weighted average of 11.8%. Similarly, the statistical analysis conducted on geographies consisting of 166,415,888 people shows a weak negative correlation between the proportion of Jordanians and percentage of females with a disability in the United States with a correlation coefficient (R) of -0.201 and weighted average of 11.3%, a difference of 5.1%.
Female Disability Correlation Summary
| Measurement | Macedonian | Jordanian |
| Minimum | 1.4% | 6.5% |
| Maximum | 20.8% | 20.5% |
| Range | 19.3% | 14.0% |
| Mean | 11.0% | 10.6% |
| Median | 11.5% | 10.9% |
| Interquartile 25% (IQ1) | 9.1% | 8.6% |
| Interquartile 75% (IQ3) | 13.1% | 11.6% |
| Interquartile Range (IQR) | 4.0% | 3.0% |
| Standard Deviation (Sample) | 3.3% | 2.5% |
| Standard Deviation (Population) | 3.3% | 2.5% |
Similar Demographics by Female Disability
Demographics Similar to Macedonians by Female Disability
In terms of female disability, the demographic groups most similar to Macedonians are Immigrants from Latvia (11.8%, a difference of 0.030%), Nicaraguan (11.9%, a difference of 0.060%), South American Indian (11.8%, a difference of 0.070%), Arab (11.9%, a difference of 0.090%), and Immigrants from Europe (11.8%, a difference of 0.17%).
| Demographics | Rating | Rank | Female Disability |
| Immigrants | North Macedonia | 96.8 /100 | #122 | Exceptional 11.8% |
| Immigrants | Croatia | 96.7 /100 | #123 | Exceptional 11.8% |
| Russians | 96.5 /100 | #124 | Exceptional 11.8% |
| Immigrants | Italy | 96.4 /100 | #125 | Exceptional 11.8% |
| Immigrants | Europe | 96.2 /100 | #126 | Exceptional 11.8% |
| South American Indians | 95.8 /100 | #127 | Exceptional 11.8% |
| Immigrants | Latvia | 95.6 /100 | #128 | Exceptional 11.8% |
| Macedonians | 95.5 /100 | #129 | Exceptional 11.8% |
| Nicaraguans | 95.2 /100 | #130 | Exceptional 11.9% |
| Arabs | 95.1 /100 | #131 | Exceptional 11.9% |
| Immigrants | Syria | 94.6 /100 | #132 | Exceptional 11.9% |
| Kenyans | 94.5 /100 | #133 | Exceptional 11.9% |
| Immigrants | Nicaragua | 94.5 /100 | #134 | Exceptional 11.9% |
| Central Americans | 94.2 /100 | #135 | Exceptional 11.9% |
| Ugandans | 94.0 /100 | #136 | Exceptional 11.9% |
Demographics Similar to Jordanians by Female Disability
In terms of female disability, the demographic groups most similar to Jordanians are Zimbabwean (11.3%, a difference of 0.0%), Tongan (11.3%, a difference of 0.010%), Immigrants from Nepal (11.3%, a difference of 0.020%), Immigrants from Sweden (11.3%, a difference of 0.060%), and Cambodian (11.3%, a difference of 0.10%).
| Demographics | Rating | Rank | Female Disability |
| Mongolians | 100.0 /100 | #40 | Exceptional 11.2% |
| Paraguayans | 100.0 /100 | #41 | Exceptional 11.2% |
| Israelis | 100.0 /100 | #42 | Exceptional 11.2% |
| Afghans | 100.0 /100 | #43 | Exceptional 11.2% |
| Cambodians | 100.0 /100 | #44 | Exceptional 11.3% |
| Immigrants | Sweden | 100.0 /100 | #45 | Exceptional 11.3% |
| Immigrants | Nepal | 100.0 /100 | #46 | Exceptional 11.3% |
| Jordanians | 100.0 /100 | #47 | Exceptional 11.3% |
| Zimbabweans | 100.0 /100 | #48 | Exceptional 11.3% |
| Tongans | 100.0 /100 | #49 | Exceptional 11.3% |
| Inupiat | 100.0 /100 | #50 | Exceptional 11.3% |
| Immigrants | Belgium | 100.0 /100 | #51 | Exceptional 11.3% |
| Immigrants | Peru | 99.9 /100 | #52 | Exceptional 11.3% |
| Immigrants | Saudi Arabia | 99.9 /100 | #53 | Exceptional 11.3% |
| Peruvians | 99.9 /100 | #54 | Exceptional 11.3% |