Macedonian vs Japanese Female Disability
COMPARE
Macedonian
Japanese
Female Disability
Female Disability Comparison
Macedonians
Japanese
11.8%
FEMALE DISABILITY
95.5/ 100
METRIC RATING
129th/ 347
METRIC RANK
12.6%
FEMALE DISABILITY
2.7/ 100
METRIC RATING
241st/ 347
METRIC RANK
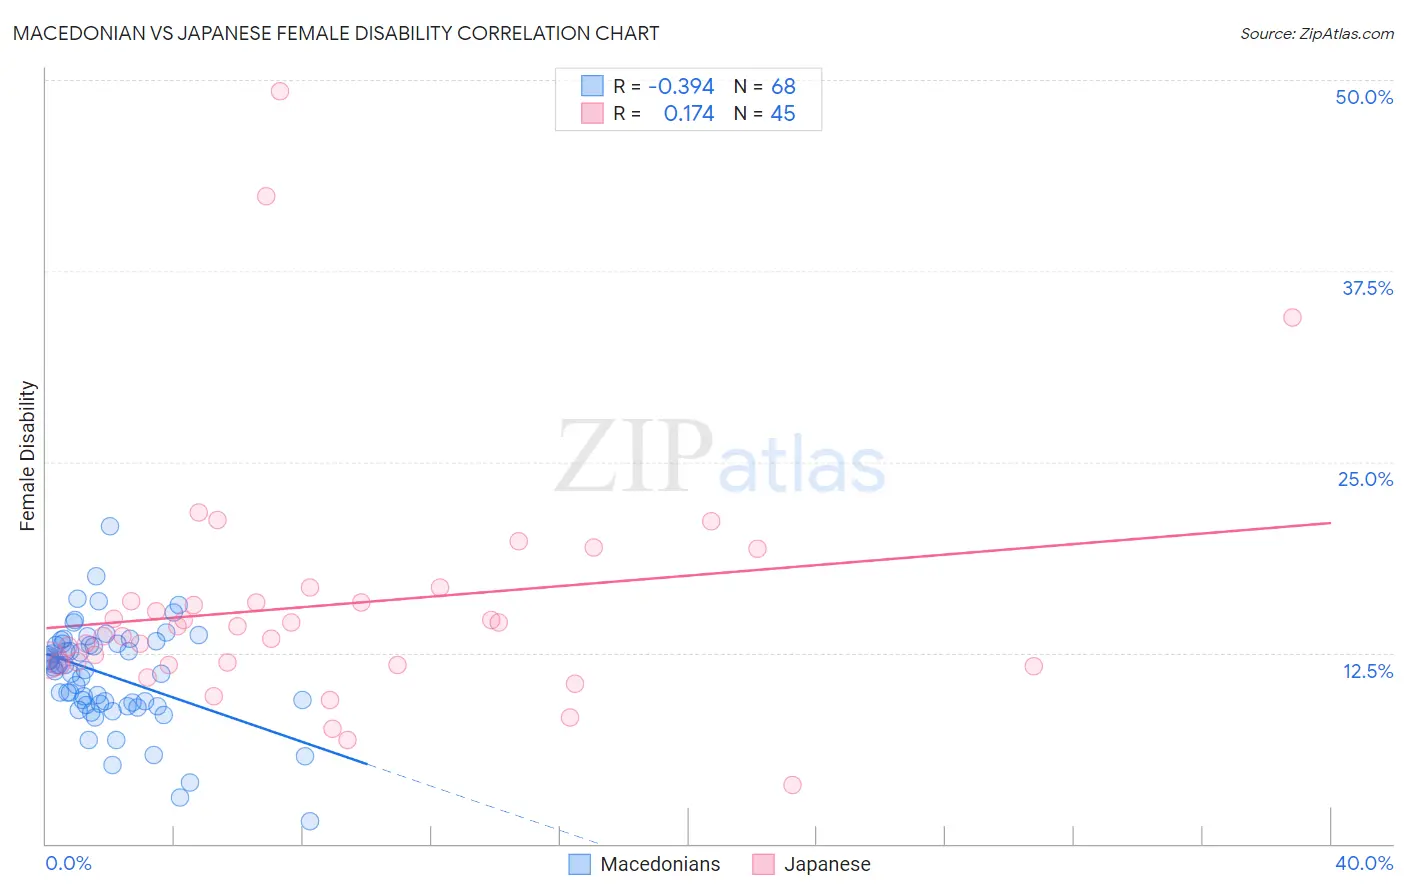
Macedonian vs Japanese Female Disability Correlation Chart
The statistical analysis conducted on geographies consisting of 132,656,541 people shows a mild negative correlation between the proportion of Macedonians and percentage of females with a disability in the United States with a correlation coefficient (R) of -0.394 and weighted average of 11.8%. Similarly, the statistical analysis conducted on geographies consisting of 249,148,020 people shows a poor positive correlation between the proportion of Japanese and percentage of females with a disability in the United States with a correlation coefficient (R) of 0.174 and weighted average of 12.6%, a difference of 6.4%.
Female Disability Correlation Summary
| Measurement | Macedonian | Japanese |
| Minimum | 1.4% | 3.8% |
| Maximum | 20.8% | 49.3% |
| Range | 19.3% | 45.4% |
| Mean | 11.0% | 15.6% |
| Median | 11.5% | 14.2% |
| Interquartile 25% (IQ1) | 9.1% | 11.8% |
| Interquartile 75% (IQ3) | 13.1% | 16.3% |
| Interquartile Range (IQR) | 4.0% | 4.6% |
| Standard Deviation (Sample) | 3.3% | 8.2% |
| Standard Deviation (Population) | 3.3% | 8.1% |
Similar Demographics by Female Disability
Demographics Similar to Macedonians by Female Disability
In terms of female disability, the demographic groups most similar to Macedonians are Immigrants from Latvia (11.8%, a difference of 0.030%), Nicaraguan (11.9%, a difference of 0.060%), South American Indian (11.8%, a difference of 0.070%), Arab (11.9%, a difference of 0.090%), and Immigrants from Europe (11.8%, a difference of 0.17%).
| Demographics | Rating | Rank | Female Disability |
| Immigrants | North Macedonia | 96.8 /100 | #122 | Exceptional 11.8% |
| Immigrants | Croatia | 96.7 /100 | #123 | Exceptional 11.8% |
| Russians | 96.5 /100 | #124 | Exceptional 11.8% |
| Immigrants | Italy | 96.4 /100 | #125 | Exceptional 11.8% |
| Immigrants | Europe | 96.2 /100 | #126 | Exceptional 11.8% |
| South American Indians | 95.8 /100 | #127 | Exceptional 11.8% |
| Immigrants | Latvia | 95.6 /100 | #128 | Exceptional 11.8% |
| Macedonians | 95.5 /100 | #129 | Exceptional 11.8% |
| Nicaraguans | 95.2 /100 | #130 | Exceptional 11.9% |
| Arabs | 95.1 /100 | #131 | Exceptional 11.9% |
| Immigrants | Syria | 94.6 /100 | #132 | Exceptional 11.9% |
| Kenyans | 94.5 /100 | #133 | Exceptional 11.9% |
| Immigrants | Nicaragua | 94.5 /100 | #134 | Exceptional 11.9% |
| Central Americans | 94.2 /100 | #135 | Exceptional 11.9% |
| Ugandans | 94.0 /100 | #136 | Exceptional 11.9% |
Demographics Similar to Japanese by Female Disability
In terms of female disability, the demographic groups most similar to Japanese are Canadian (12.6%, a difference of 0.050%), Immigrants from Senegal (12.6%, a difference of 0.060%), Alsatian (12.6%, a difference of 0.070%), German Russian (12.6%, a difference of 0.17%), and Immigrants from Jamaica (12.6%, a difference of 0.21%).
| Demographics | Rating | Rank | Female Disability |
| Scandinavians | 5.3 /100 | #234 | Tragic 12.5% |
| Malaysians | 5.0 /100 | #235 | Tragic 12.5% |
| Immigrants | West Indies | 4.4 /100 | #236 | Tragic 12.6% |
| Slavs | 3.8 /100 | #237 | Tragic 12.6% |
| Yugoslavians | 3.7 /100 | #238 | Tragic 12.6% |
| Barbadians | 3.6 /100 | #239 | Tragic 12.6% |
| German Russians | 3.2 /100 | #240 | Tragic 12.6% |
| Japanese | 2.7 /100 | #241 | Tragic 12.6% |
| Canadians | 2.6 /100 | #242 | Tragic 12.6% |
| Immigrants | Senegal | 2.5 /100 | #243 | Tragic 12.6% |
| Alsatians | 2.5 /100 | #244 | Tragic 12.6% |
| Immigrants | Jamaica | 2.2 /100 | #245 | Tragic 12.6% |
| Spanish American Indians | 2.1 /100 | #246 | Tragic 12.6% |
| Menominee | 2.1 /100 | #247 | Tragic 12.6% |
| Carpatho Rusyns | 2.0 /100 | #248 | Tragic 12.6% |