Blackfeet vs Jordanian Female Disability
COMPARE
Blackfeet
Jordanian
Female Disability
Female Disability Comparison
Blackfeet
Jordanians
13.8%
FEMALE DISABILITY
0.0/ 100
METRIC RATING
313th/ 347
METRIC RANK
11.3%
FEMALE DISABILITY
100.0/ 100
METRIC RATING
47th/ 347
METRIC RANK
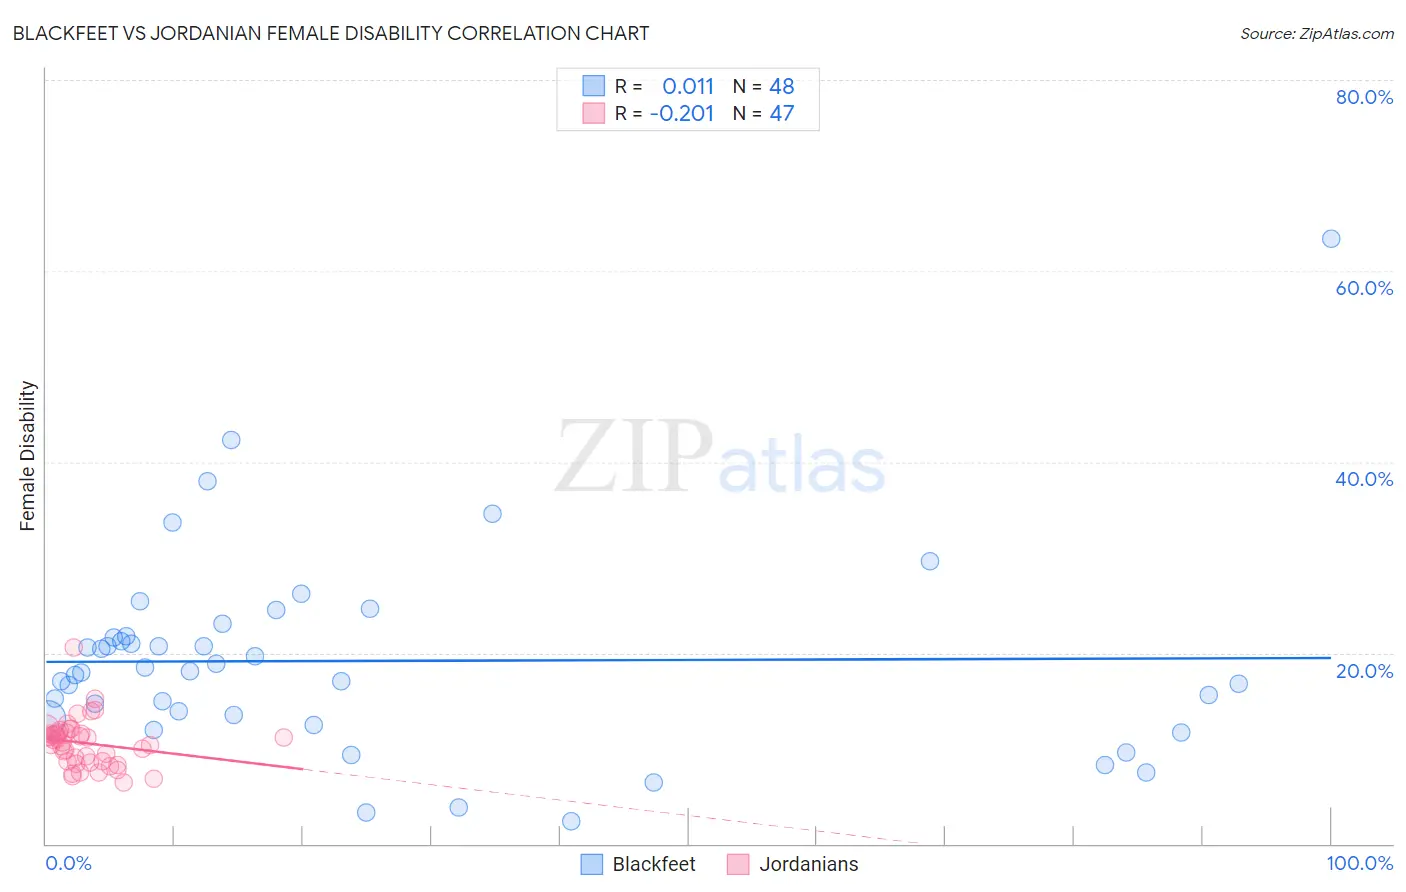
Blackfeet vs Jordanian Female Disability Correlation Chart
The statistical analysis conducted on geographies consisting of 309,506,934 people shows no correlation between the proportion of Blackfeet and percentage of females with a disability in the United States with a correlation coefficient (R) of 0.011 and weighted average of 13.8%. Similarly, the statistical analysis conducted on geographies consisting of 166,415,888 people shows a weak negative correlation between the proportion of Jordanians and percentage of females with a disability in the United States with a correlation coefficient (R) of -0.201 and weighted average of 11.3%, a difference of 22.7%.
Female Disability Correlation Summary
| Measurement | Blackfeet | Jordanian |
| Minimum | 2.3% | 6.5% |
| Maximum | 63.4% | 20.5% |
| Range | 61.1% | 14.0% |
| Mean | 19.1% | 10.6% |
| Median | 18.0% | 10.9% |
| Interquartile 25% (IQ1) | 13.3% | 8.6% |
| Interquartile 75% (IQ3) | 21.7% | 11.6% |
| Interquartile Range (IQR) | 8.4% | 3.0% |
| Standard Deviation (Sample) | 10.6% | 2.5% |
| Standard Deviation (Population) | 10.5% | 2.5% |
Similar Demographics by Female Disability
Demographics Similar to Blackfeet by Female Disability
In terms of female disability, the demographic groups most similar to Blackfeet are Puget Sound Salish (13.8%, a difference of 0.10%), Delaware (13.8%, a difference of 0.32%), Hopi (13.7%, a difference of 0.63%), Alaskan Athabascan (13.9%, a difference of 0.69%), and Apache (13.7%, a difference of 0.91%).
| Demographics | Rating | Rank | Female Disability |
| French Canadians | 0.0 /100 | #306 | Tragic 13.6% |
| Central American Indians | 0.0 /100 | #307 | Tragic 13.6% |
| Cree | 0.0 /100 | #308 | Tragic 13.7% |
| French American Indians | 0.0 /100 | #309 | Tragic 13.7% |
| Apache | 0.0 /100 | #310 | Tragic 13.7% |
| Hopi | 0.0 /100 | #311 | Tragic 13.7% |
| Delaware | 0.0 /100 | #312 | Tragic 13.8% |
| Blackfeet | 0.0 /100 | #313 | Tragic 13.8% |
| Puget Sound Salish | 0.0 /100 | #314 | Tragic 13.8% |
| Alaskan Athabascans | 0.0 /100 | #315 | Tragic 13.9% |
| Spanish Americans | 0.0 /100 | #316 | Tragic 14.0% |
| Chippewa | 0.0 /100 | #317 | Tragic 14.0% |
| Paiute | 0.0 /100 | #318 | Tragic 14.0% |
| Iroquois | 0.0 /100 | #319 | Tragic 14.0% |
| Americans | 0.0 /100 | #320 | Tragic 14.1% |
Demographics Similar to Jordanians by Female Disability
In terms of female disability, the demographic groups most similar to Jordanians are Zimbabwean (11.3%, a difference of 0.0%), Tongan (11.3%, a difference of 0.010%), Immigrants from Nepal (11.3%, a difference of 0.020%), Immigrants from Sweden (11.3%, a difference of 0.060%), and Cambodian (11.3%, a difference of 0.10%).
| Demographics | Rating | Rank | Female Disability |
| Mongolians | 100.0 /100 | #40 | Exceptional 11.2% |
| Paraguayans | 100.0 /100 | #41 | Exceptional 11.2% |
| Israelis | 100.0 /100 | #42 | Exceptional 11.2% |
| Afghans | 100.0 /100 | #43 | Exceptional 11.2% |
| Cambodians | 100.0 /100 | #44 | Exceptional 11.3% |
| Immigrants | Sweden | 100.0 /100 | #45 | Exceptional 11.3% |
| Immigrants | Nepal | 100.0 /100 | #46 | Exceptional 11.3% |
| Jordanians | 100.0 /100 | #47 | Exceptional 11.3% |
| Zimbabweans | 100.0 /100 | #48 | Exceptional 11.3% |
| Tongans | 100.0 /100 | #49 | Exceptional 11.3% |
| Inupiat | 100.0 /100 | #50 | Exceptional 11.3% |
| Immigrants | Belgium | 100.0 /100 | #51 | Exceptional 11.3% |
| Immigrants | Peru | 99.9 /100 | #52 | Exceptional 11.3% |
| Immigrants | Saudi Arabia | 99.9 /100 | #53 | Exceptional 11.3% |
| Peruvians | 99.9 /100 | #54 | Exceptional 11.3% |