Immigrants from Bahamas vs Jordanian Female Disability
COMPARE
Immigrants from Bahamas
Jordanian
Female Disability
Female Disability Comparison
Immigrants from Bahamas
Jordanians
12.4%
FEMALE DISABILITY
12.5/ 100
METRIC RATING
218th/ 347
METRIC RANK
11.3%
FEMALE DISABILITY
100.0/ 100
METRIC RATING
47th/ 347
METRIC RANK
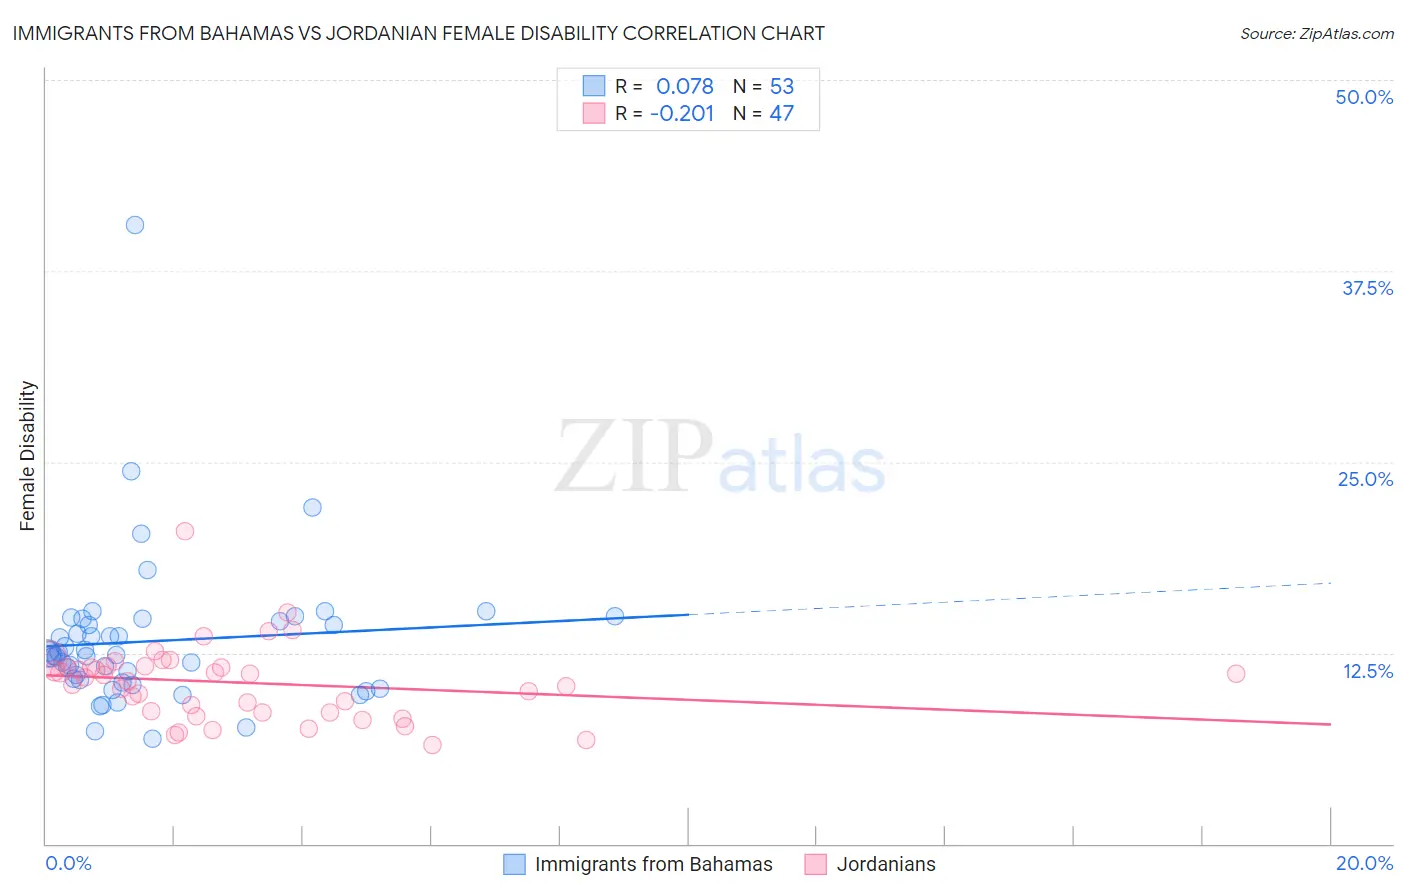
Immigrants from Bahamas vs Jordanian Female Disability Correlation Chart
The statistical analysis conducted on geographies consisting of 104,653,702 people shows a slight positive correlation between the proportion of Immigrants from Bahamas and percentage of females with a disability in the United States with a correlation coefficient (R) of 0.078 and weighted average of 12.4%. Similarly, the statistical analysis conducted on geographies consisting of 166,415,888 people shows a weak negative correlation between the proportion of Jordanians and percentage of females with a disability in the United States with a correlation coefficient (R) of -0.201 and weighted average of 11.3%, a difference of 10.2%.
Female Disability Correlation Summary
| Measurement | Immigrants from Bahamas | Jordanian |
| Minimum | 6.9% | 6.5% |
| Maximum | 40.5% | 20.5% |
| Range | 33.6% | 14.0% |
| Mean | 13.3% | 10.6% |
| Median | 12.4% | 10.9% |
| Interquartile 25% (IQ1) | 10.6% | 8.6% |
| Interquartile 75% (IQ3) | 14.6% | 11.6% |
| Interquartile Range (IQR) | 4.0% | 3.0% |
| Standard Deviation (Sample) | 5.0% | 2.5% |
| Standard Deviation (Population) | 5.0% | 2.5% |
Similar Demographics by Female Disability
Demographics Similar to Immigrants from Bahamas by Female Disability
In terms of female disability, the demographic groups most similar to Immigrants from Bahamas are British (12.4%, a difference of 0.020%), European (12.4%, a difference of 0.030%), Immigrants from Burma/Myanmar (12.4%, a difference of 0.070%), Panamanian (12.4%, a difference of 0.080%), and Samoan (12.4%, a difference of 0.080%).
| Demographics | Rating | Rank | Female Disability |
| Immigrants | Bosnia and Herzegovina | 14.8 /100 | #211 | Poor 12.4% |
| Ute | 14.7 /100 | #212 | Poor 12.4% |
| Immigrants | Thailand | 14.5 /100 | #213 | Poor 12.4% |
| Panamanians | 13.5 /100 | #214 | Poor 12.4% |
| Samoans | 13.4 /100 | #215 | Poor 12.4% |
| Immigrants | Burma/Myanmar | 13.3 /100 | #216 | Poor 12.4% |
| British | 12.7 /100 | #217 | Poor 12.4% |
| Immigrants | Bahamas | 12.5 /100 | #218 | Poor 12.4% |
| Europeans | 12.1 /100 | #219 | Poor 12.4% |
| Bahamians | 11.1 /100 | #220 | Poor 12.4% |
| Native Hawaiians | 10.8 /100 | #221 | Poor 12.4% |
| Italians | 10.7 /100 | #222 | Poor 12.4% |
| Guamanians/Chamorros | 9.5 /100 | #223 | Tragic 12.5% |
| Belizeans | 9.3 /100 | #224 | Tragic 12.5% |
| Poles | 8.4 /100 | #225 | Tragic 12.5% |
Demographics Similar to Jordanians by Female Disability
In terms of female disability, the demographic groups most similar to Jordanians are Zimbabwean (11.3%, a difference of 0.0%), Tongan (11.3%, a difference of 0.010%), Immigrants from Nepal (11.3%, a difference of 0.020%), Immigrants from Sweden (11.3%, a difference of 0.060%), and Cambodian (11.3%, a difference of 0.10%).
| Demographics | Rating | Rank | Female Disability |
| Mongolians | 100.0 /100 | #40 | Exceptional 11.2% |
| Paraguayans | 100.0 /100 | #41 | Exceptional 11.2% |
| Israelis | 100.0 /100 | #42 | Exceptional 11.2% |
| Afghans | 100.0 /100 | #43 | Exceptional 11.2% |
| Cambodians | 100.0 /100 | #44 | Exceptional 11.3% |
| Immigrants | Sweden | 100.0 /100 | #45 | Exceptional 11.3% |
| Immigrants | Nepal | 100.0 /100 | #46 | Exceptional 11.3% |
| Jordanians | 100.0 /100 | #47 | Exceptional 11.3% |
| Zimbabweans | 100.0 /100 | #48 | Exceptional 11.3% |
| Tongans | 100.0 /100 | #49 | Exceptional 11.3% |
| Inupiat | 100.0 /100 | #50 | Exceptional 11.3% |
| Immigrants | Belgium | 100.0 /100 | #51 | Exceptional 11.3% |
| Immigrants | Peru | 99.9 /100 | #52 | Exceptional 11.3% |
| Immigrants | Saudi Arabia | 99.9 /100 | #53 | Exceptional 11.3% |
| Peruvians | 99.9 /100 | #54 | Exceptional 11.3% |