Immigrants from Mexico vs Jordanian Female Disability
COMPARE
Immigrants from Mexico
Jordanian
Female Disability
Female Disability Comparison
Immigrants from Mexico
Jordanians
12.2%
FEMALE DISABILITY
50.8/ 100
METRIC RATING
173rd/ 347
METRIC RANK
11.3%
FEMALE DISABILITY
100.0/ 100
METRIC RATING
47th/ 347
METRIC RANK
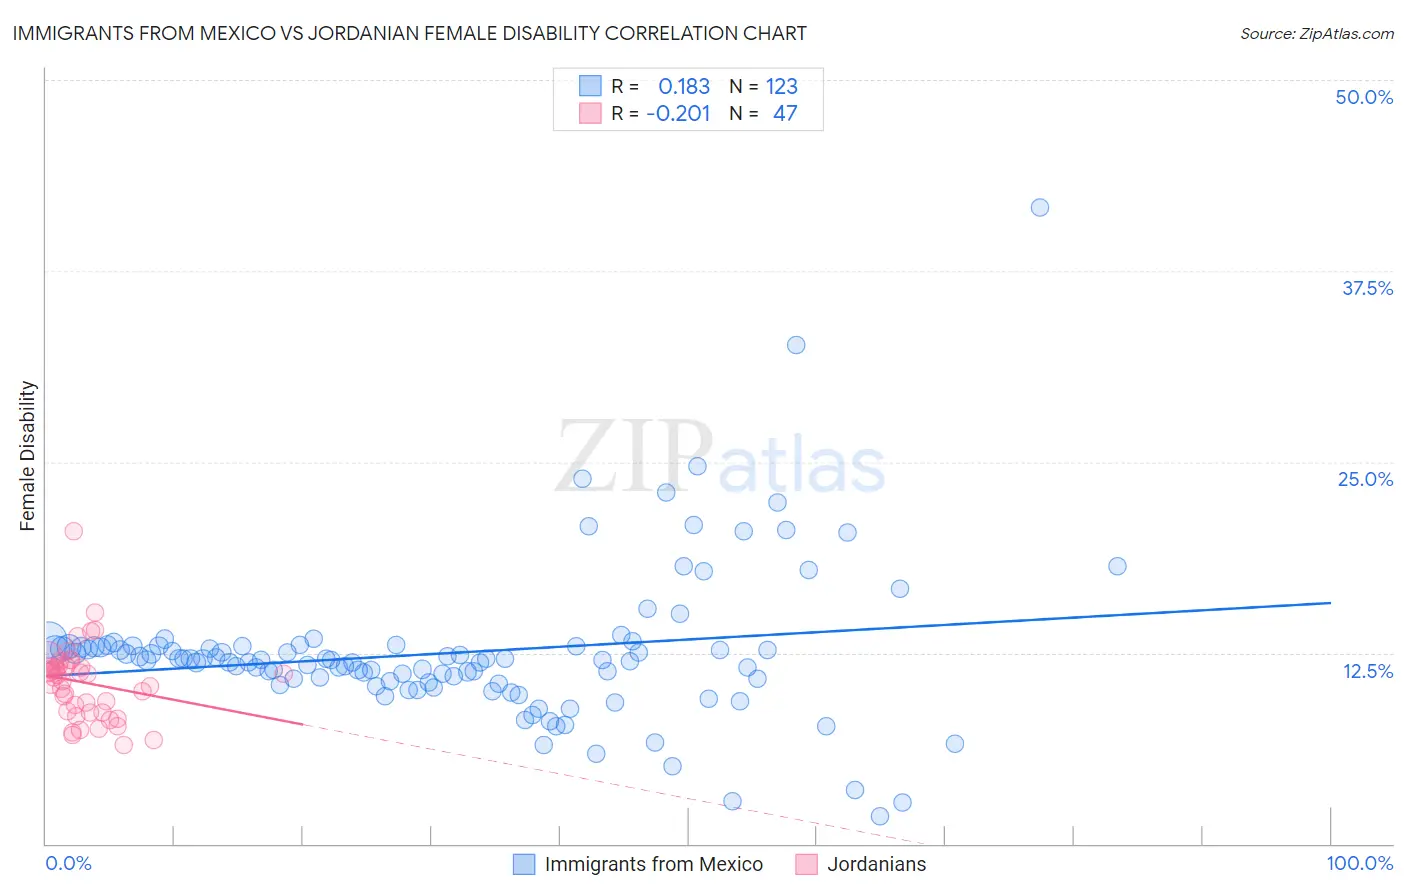
Immigrants from Mexico vs Jordanian Female Disability Correlation Chart
The statistical analysis conducted on geographies consisting of 513,519,603 people shows a poor positive correlation between the proportion of Immigrants from Mexico and percentage of females with a disability in the United States with a correlation coefficient (R) of 0.183 and weighted average of 12.2%. Similarly, the statistical analysis conducted on geographies consisting of 166,415,888 people shows a weak negative correlation between the proportion of Jordanians and percentage of females with a disability in the United States with a correlation coefficient (R) of -0.201 and weighted average of 11.3%, a difference of 8.2%.
Female Disability Correlation Summary
| Measurement | Immigrants from Mexico | Jordanian |
| Minimum | 1.8% | 6.5% |
| Maximum | 41.7% | 20.5% |
| Range | 39.9% | 14.0% |
| Mean | 12.5% | 10.6% |
| Median | 12.1% | 10.9% |
| Interquartile 25% (IQ1) | 10.6% | 8.6% |
| Interquartile 75% (IQ3) | 12.9% | 11.6% |
| Interquartile Range (IQR) | 2.4% | 3.0% |
| Standard Deviation (Sample) | 5.0% | 2.5% |
| Standard Deviation (Population) | 5.0% | 2.5% |
Similar Demographics by Female Disability
Demographics Similar to Immigrants from Mexico by Female Disability
In terms of female disability, the demographic groups most similar to Immigrants from Mexico are Immigrants from England (12.2%, a difference of 0.030%), Haitian (12.2%, a difference of 0.040%), Immigrants from St. Vincent and the Grenadines (12.2%, a difference of 0.040%), Immigrants from Southern Europe (12.2%, a difference of 0.21%), and Maltese (12.2%, a difference of 0.23%).
| Demographics | Rating | Rank | Female Disability |
| Lithuanians | 59.5 /100 | #166 | Average 12.2% |
| Immigrants | Latin America | 59.0 /100 | #167 | Average 12.2% |
| Immigrants | Haiti | 58.8 /100 | #168 | Average 12.2% |
| Lebanese | 58.1 /100 | #169 | Average 12.2% |
| Maltese | 57.0 /100 | #170 | Average 12.2% |
| Immigrants | Southern Europe | 56.3 /100 | #171 | Average 12.2% |
| Haitians | 51.9 /100 | #172 | Average 12.2% |
| Immigrants | Mexico | 50.8 /100 | #173 | Average 12.2% |
| Immigrants | England | 50.0 /100 | #174 | Average 12.2% |
| Immigrants | St. Vincent and the Grenadines | 49.7 /100 | #175 | Average 12.2% |
| Immigrants | Guyana | 43.1 /100 | #176 | Average 12.2% |
| Immigrants | Ghana | 42.5 /100 | #177 | Average 12.2% |
| Immigrants | Western Europe | 40.9 /100 | #178 | Average 12.2% |
| Immigrants | Fiji | 38.2 /100 | #179 | Fair 12.3% |
| Albanians | 37.9 /100 | #180 | Fair 12.3% |
Demographics Similar to Jordanians by Female Disability
In terms of female disability, the demographic groups most similar to Jordanians are Zimbabwean (11.3%, a difference of 0.0%), Tongan (11.3%, a difference of 0.010%), Immigrants from Nepal (11.3%, a difference of 0.020%), Immigrants from Sweden (11.3%, a difference of 0.060%), and Cambodian (11.3%, a difference of 0.10%).
| Demographics | Rating | Rank | Female Disability |
| Mongolians | 100.0 /100 | #40 | Exceptional 11.2% |
| Paraguayans | 100.0 /100 | #41 | Exceptional 11.2% |
| Israelis | 100.0 /100 | #42 | Exceptional 11.2% |
| Afghans | 100.0 /100 | #43 | Exceptional 11.2% |
| Cambodians | 100.0 /100 | #44 | Exceptional 11.3% |
| Immigrants | Sweden | 100.0 /100 | #45 | Exceptional 11.3% |
| Immigrants | Nepal | 100.0 /100 | #46 | Exceptional 11.3% |
| Jordanians | 100.0 /100 | #47 | Exceptional 11.3% |
| Zimbabweans | 100.0 /100 | #48 | Exceptional 11.3% |
| Tongans | 100.0 /100 | #49 | Exceptional 11.3% |
| Inupiat | 100.0 /100 | #50 | Exceptional 11.3% |
| Immigrants | Belgium | 100.0 /100 | #51 | Exceptional 11.3% |
| Immigrants | Peru | 99.9 /100 | #52 | Exceptional 11.3% |
| Immigrants | Saudi Arabia | 99.9 /100 | #53 | Exceptional 11.3% |
| Peruvians | 99.9 /100 | #54 | Exceptional 11.3% |