Macedonian vs Colombian Female Disability
COMPARE
Macedonian
Colombian
Female Disability
Female Disability Comparison
Macedonians
Colombians
11.8%
FEMALE DISABILITY
95.5/ 100
METRIC RATING
129th/ 347
METRIC RANK
11.5%
FEMALE DISABILITY
99.8/ 100
METRIC RATING
69th/ 347
METRIC RANK
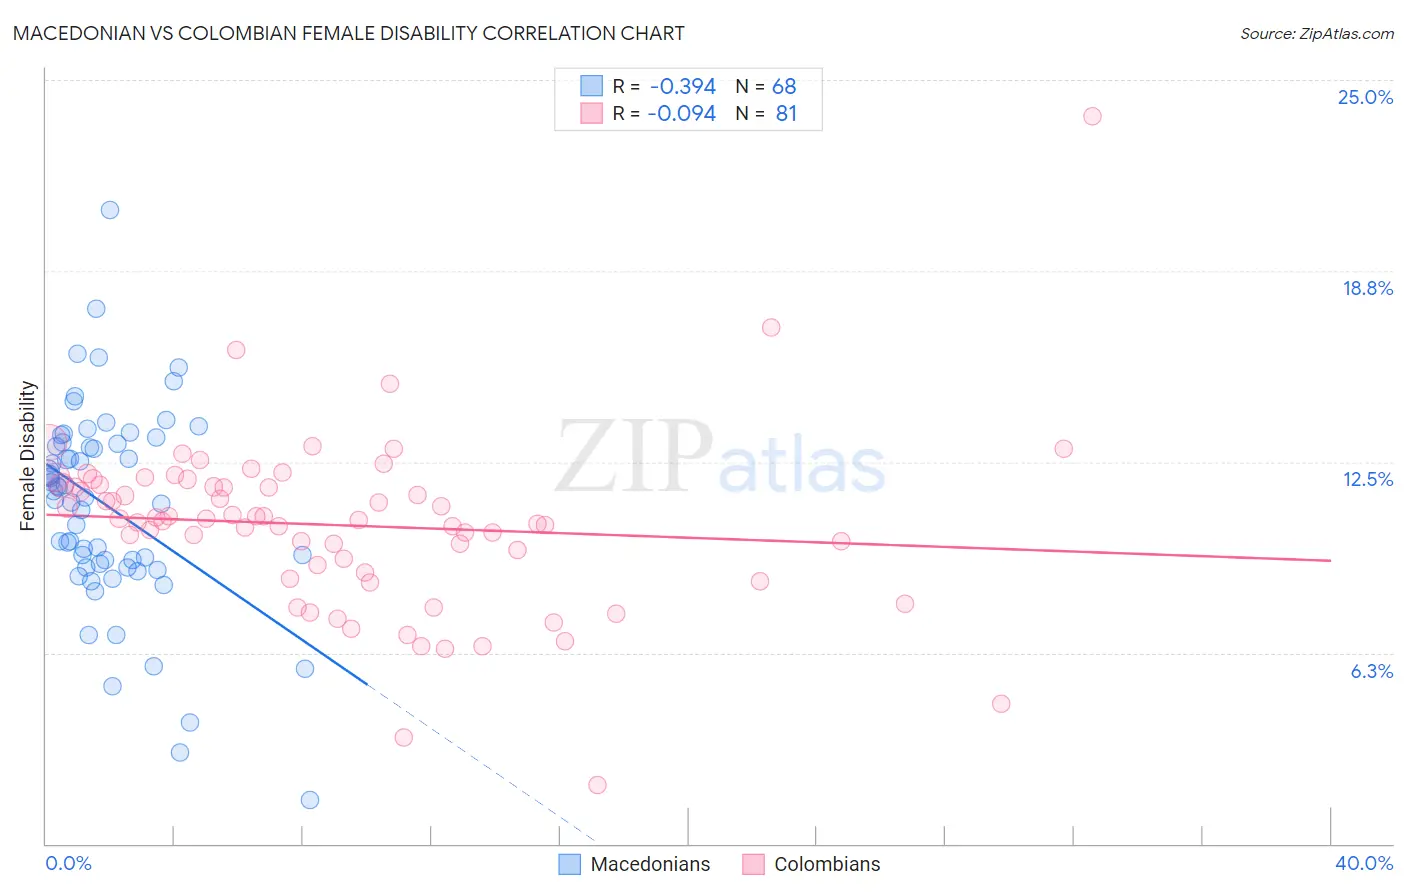
Macedonian vs Colombian Female Disability Correlation Chart
The statistical analysis conducted on geographies consisting of 132,656,541 people shows a mild negative correlation between the proportion of Macedonians and percentage of females with a disability in the United States with a correlation coefficient (R) of -0.394 and weighted average of 11.8%. Similarly, the statistical analysis conducted on geographies consisting of 419,587,687 people shows a slight negative correlation between the proportion of Colombians and percentage of females with a disability in the United States with a correlation coefficient (R) of -0.094 and weighted average of 11.5%, a difference of 3.2%.
Female Disability Correlation Summary
| Measurement | Macedonian | Colombian |
| Minimum | 1.4% | 1.9% |
| Maximum | 20.8% | 23.8% |
| Range | 19.3% | 21.9% |
| Mean | 11.0% | 10.4% |
| Median | 11.5% | 10.6% |
| Interquartile 25% (IQ1) | 9.1% | 9.0% |
| Interquartile 75% (IQ3) | 13.1% | 11.7% |
| Interquartile Range (IQR) | 4.0% | 2.7% |
| Standard Deviation (Sample) | 3.3% | 2.9% |
| Standard Deviation (Population) | 3.3% | 2.9% |
Similar Demographics by Female Disability
Demographics Similar to Macedonians by Female Disability
In terms of female disability, the demographic groups most similar to Macedonians are Immigrants from Latvia (11.8%, a difference of 0.030%), Nicaraguan (11.9%, a difference of 0.060%), South American Indian (11.8%, a difference of 0.070%), Arab (11.9%, a difference of 0.090%), and Immigrants from Europe (11.8%, a difference of 0.17%).
| Demographics | Rating | Rank | Female Disability |
| Immigrants | North Macedonia | 96.8 /100 | #122 | Exceptional 11.8% |
| Immigrants | Croatia | 96.7 /100 | #123 | Exceptional 11.8% |
| Russians | 96.5 /100 | #124 | Exceptional 11.8% |
| Immigrants | Italy | 96.4 /100 | #125 | Exceptional 11.8% |
| Immigrants | Europe | 96.2 /100 | #126 | Exceptional 11.8% |
| South American Indians | 95.8 /100 | #127 | Exceptional 11.8% |
| Immigrants | Latvia | 95.6 /100 | #128 | Exceptional 11.8% |
| Macedonians | 95.5 /100 | #129 | Exceptional 11.8% |
| Nicaraguans | 95.2 /100 | #130 | Exceptional 11.9% |
| Arabs | 95.1 /100 | #131 | Exceptional 11.9% |
| Immigrants | Syria | 94.6 /100 | #132 | Exceptional 11.9% |
| Kenyans | 94.5 /100 | #133 | Exceptional 11.9% |
| Immigrants | Nicaragua | 94.5 /100 | #134 | Exceptional 11.9% |
| Central Americans | 94.2 /100 | #135 | Exceptional 11.9% |
| Ugandans | 94.0 /100 | #136 | Exceptional 11.9% |
Demographics Similar to Colombians by Female Disability
In terms of female disability, the demographic groups most similar to Colombians are Immigrants from Chile (11.5%, a difference of 0.010%), Immigrants from Ireland (11.5%, a difference of 0.050%), Immigrants from Northern Africa (11.5%, a difference of 0.070%), Immigrants from Vietnam (11.5%, a difference of 0.090%), and Chilean (11.5%, a difference of 0.12%).
| Demographics | Rating | Rank | Female Disability |
| Sri Lankans | 99.9 /100 | #62 | Exceptional 11.4% |
| Immigrants | Colombia | 99.9 /100 | #63 | Exceptional 11.4% |
| Immigrants | El Salvador | 99.9 /100 | #64 | Exceptional 11.4% |
| Immigrants | South America | 99.9 /100 | #65 | Exceptional 11.4% |
| Salvadorans | 99.8 /100 | #66 | Exceptional 11.5% |
| Immigrants | Vietnam | 99.8 /100 | #67 | Exceptional 11.5% |
| Immigrants | Northern Africa | 99.8 /100 | #68 | Exceptional 11.5% |
| Colombians | 99.8 /100 | #69 | Exceptional 11.5% |
| Immigrants | Chile | 99.8 /100 | #70 | Exceptional 11.5% |
| Immigrants | Ireland | 99.8 /100 | #71 | Exceptional 11.5% |
| Chileans | 99.8 /100 | #72 | Exceptional 11.5% |
| Immigrants | Switzerland | 99.8 /100 | #73 | Exceptional 11.5% |
| Bhutanese | 99.8 /100 | #74 | Exceptional 11.5% |
| Immigrants | Lebanon | 99.7 /100 | #75 | Exceptional 11.5% |
| Immigrants | Eritrea | 99.7 /100 | #76 | Exceptional 11.5% |