Immigrants from Uruguay vs Venezuelan Vision Disability
COMPARE
Immigrants from Uruguay
Venezuelan
Vision Disability
Vision Disability Comparison
Immigrants from Uruguay
Venezuelans
2.2%
VISION DISABILITY
11.5/ 100
METRIC RATING
210th/ 347
METRIC RANK
2.1%
VISION DISABILITY
87.2/ 100
METRIC RATING
134th/ 347
METRIC RANK
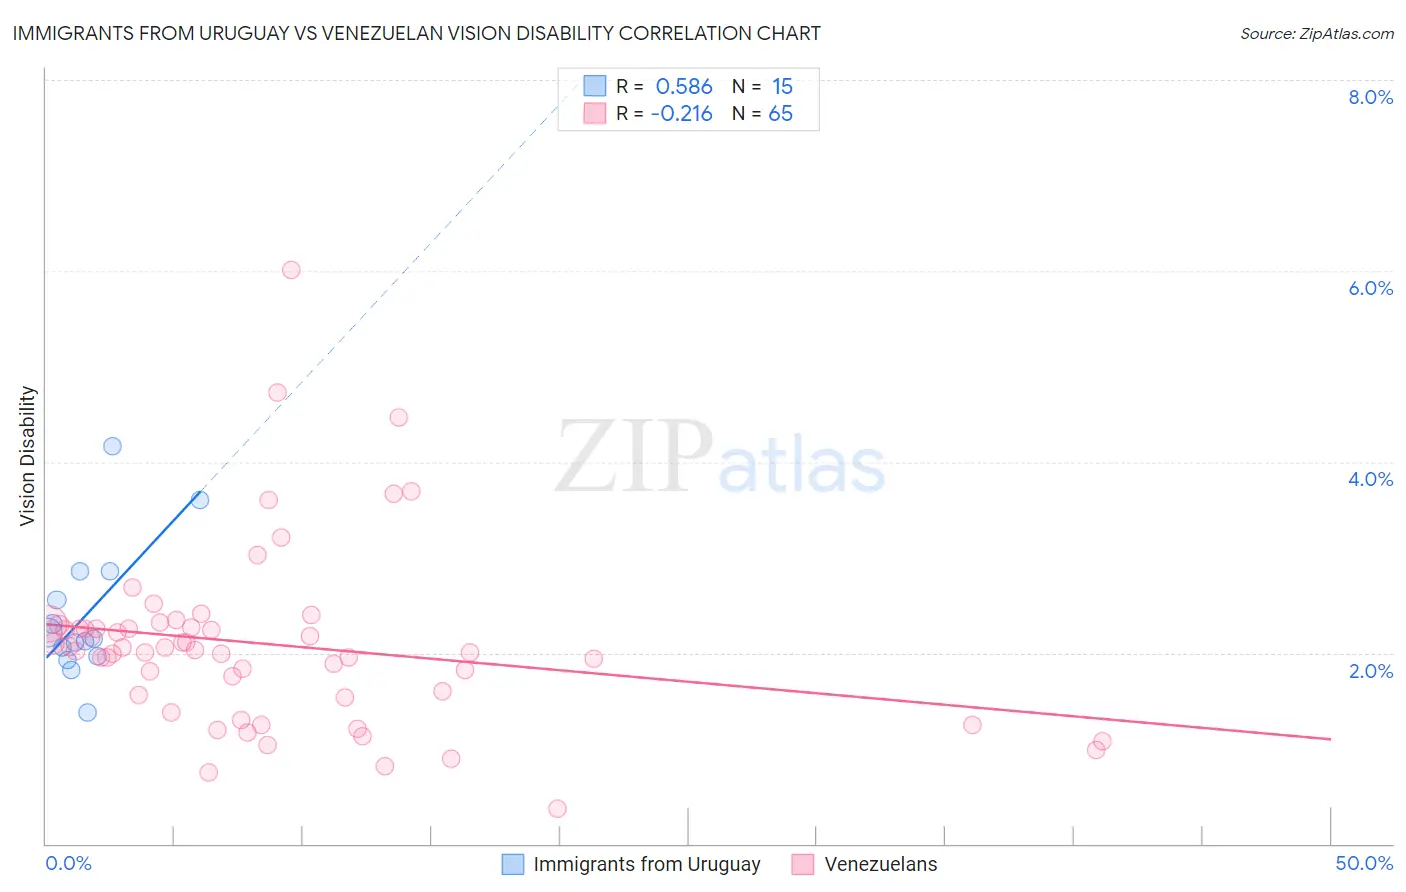
Immigrants from Uruguay vs Venezuelan Vision Disability Correlation Chart
The statistical analysis conducted on geographies consisting of 133,246,833 people shows a substantial positive correlation between the proportion of Immigrants from Uruguay and percentage of population with vision disability in the United States with a correlation coefficient (R) of 0.586 and weighted average of 2.2%. Similarly, the statistical analysis conducted on geographies consisting of 306,200,633 people shows a weak negative correlation between the proportion of Venezuelans and percentage of population with vision disability in the United States with a correlation coefficient (R) of -0.216 and weighted average of 2.1%, a difference of 6.4%.
Vision Disability Correlation Summary
| Measurement | Immigrants from Uruguay | Venezuelan |
| Minimum | 1.4% | 0.36% |
| Maximum | 4.2% | 6.0% |
| Range | 2.8% | 5.6% |
| Mean | 2.4% | 2.1% |
| Median | 2.1% | 2.0% |
| Interquartile 25% (IQ1) | 2.0% | 1.5% |
| Interquartile 75% (IQ3) | 2.8% | 2.3% |
| Interquartile Range (IQR) | 0.89% | 0.73% |
| Standard Deviation (Sample) | 0.72% | 0.94% |
| Standard Deviation (Population) | 0.69% | 0.94% |
Similar Demographics by Vision Disability
Demographics Similar to Immigrants from Uruguay by Vision Disability
In terms of vision disability, the demographic groups most similar to Immigrants from Uruguay are Immigrants from Brazil (2.2%, a difference of 0.23%), Immigrants from Nigeria (2.2%, a difference of 0.27%), German (2.2%, a difference of 0.27%), Indonesian (2.2%, a difference of 0.34%), and Pennsylvania German (2.2%, a difference of 0.41%).
| Demographics | Rating | Rank | Vision Disability |
| Dutch | 17.1 /100 | #203 | Poor 2.2% |
| Immigrants | Guyana | 15.9 /100 | #204 | Poor 2.2% |
| Samoans | 15.7 /100 | #205 | Poor 2.2% |
| Pennsylvania Germans | 14.5 /100 | #206 | Poor 2.2% |
| Immigrants | Nigeria | 13.5 /100 | #207 | Poor 2.2% |
| Germans | 13.4 /100 | #208 | Poor 2.2% |
| Immigrants | Brazil | 13.1 /100 | #209 | Poor 2.2% |
| Immigrants | Uruguay | 11.5 /100 | #210 | Poor 2.2% |
| Indonesians | 9.5 /100 | #211 | Tragic 2.2% |
| Bermudans | 9.0 /100 | #212 | Tragic 2.2% |
| Immigrants | Ghana | 8.9 /100 | #213 | Tragic 2.2% |
| Trinidadians and Tobagonians | 8.2 /100 | #214 | Tragic 2.2% |
| Nigerians | 7.2 /100 | #215 | Tragic 2.3% |
| Immigrants | Trinidad and Tobago | 6.1 /100 | #216 | Tragic 2.3% |
| Barbadians | 5.1 /100 | #217 | Tragic 2.3% |
Demographics Similar to Venezuelans by Vision Disability
In terms of vision disability, the demographic groups most similar to Venezuelans are Syrian (2.1%, a difference of 0.050%), Vietnamese (2.1%, a difference of 0.070%), Czech (2.1%, a difference of 0.12%), Immigrants from South Eastern Asia (2.1%, a difference of 0.12%), and Arab (2.1%, a difference of 0.13%).
| Demographics | Rating | Rank | Vision Disability |
| Sudanese | 89.2 /100 | #127 | Excellent 2.1% |
| Immigrants | Chile | 89.0 /100 | #128 | Excellent 2.1% |
| Immigrants | Cameroon | 88.8 /100 | #129 | Excellent 2.1% |
| Immigrants | Kenya | 88.7 /100 | #130 | Excellent 2.1% |
| Immigrants | Hungary | 88.7 /100 | #131 | Excellent 2.1% |
| New Zealanders | 88.2 /100 | #132 | Excellent 2.1% |
| Syrians | 87.5 /100 | #133 | Excellent 2.1% |
| Venezuelans | 87.2 /100 | #134 | Excellent 2.1% |
| Vietnamese | 86.7 /100 | #135 | Excellent 2.1% |
| Czechs | 86.3 /100 | #136 | Excellent 2.1% |
| Immigrants | South Eastern Asia | 86.3 /100 | #137 | Excellent 2.1% |
| Arabs | 86.3 /100 | #138 | Excellent 2.1% |
| Immigrants | Morocco | 85.2 /100 | #139 | Excellent 2.1% |
| Immigrants | Netherlands | 84.2 /100 | #140 | Excellent 2.1% |
| Sierra Leoneans | 84.1 /100 | #141 | Excellent 2.1% |