Spanish American Indian vs Venezuelan Vision Disability
COMPARE
Spanish American Indian
Venezuelan
Vision Disability
Vision Disability Comparison
Spanish American Indians
Venezuelans
2.6%
VISION DISABILITY
0.0/ 100
METRIC RATING
302nd/ 347
METRIC RANK
2.1%
VISION DISABILITY
87.2/ 100
METRIC RATING
134th/ 347
METRIC RANK
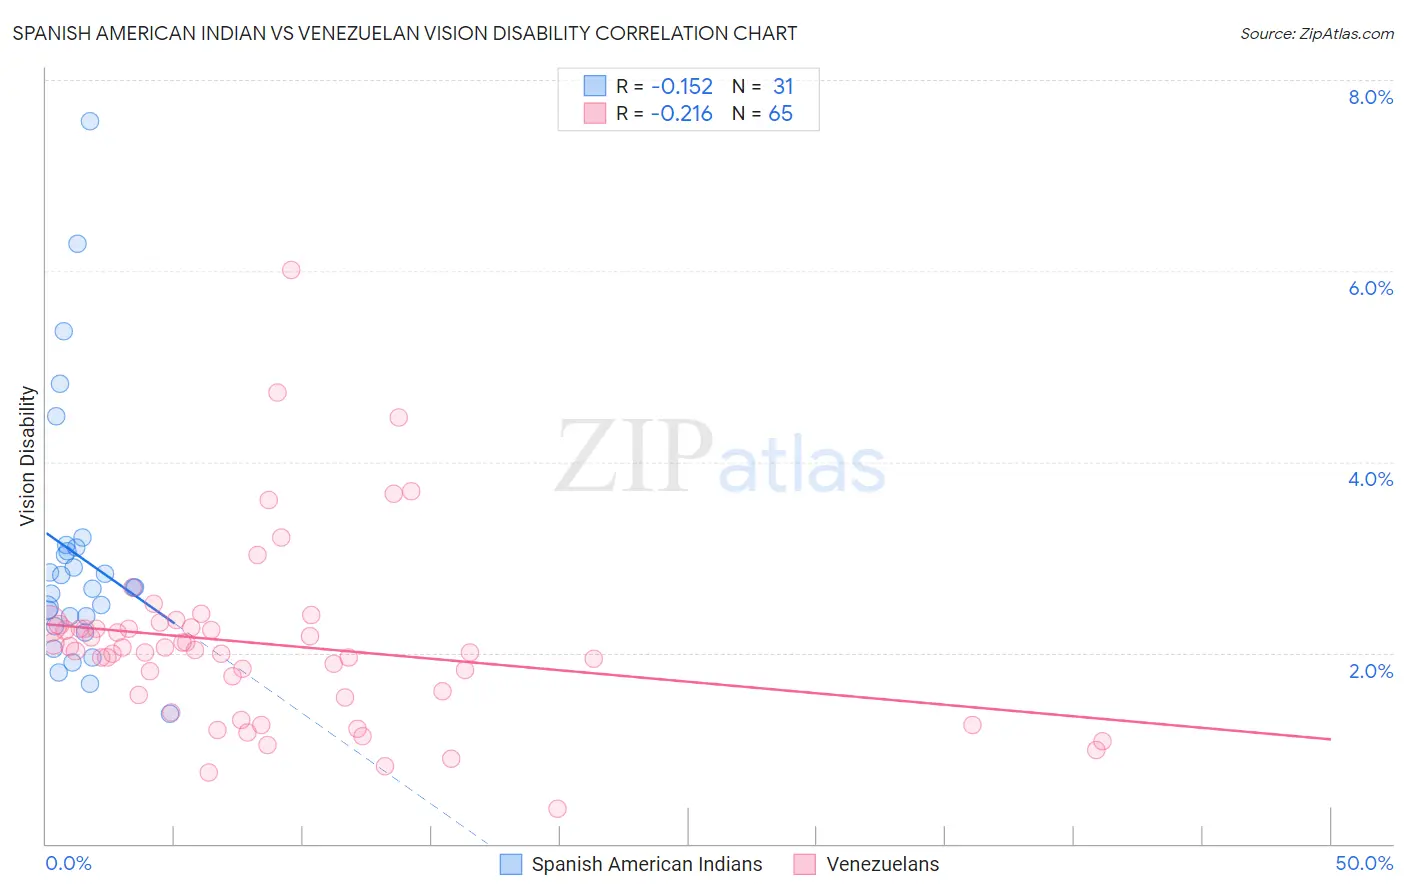
Spanish American Indian vs Venezuelan Vision Disability Correlation Chart
The statistical analysis conducted on geographies consisting of 73,139,159 people shows a poor negative correlation between the proportion of Spanish American Indians and percentage of population with vision disability in the United States with a correlation coefficient (R) of -0.152 and weighted average of 2.6%. Similarly, the statistical analysis conducted on geographies consisting of 306,200,633 people shows a weak negative correlation between the proportion of Venezuelans and percentage of population with vision disability in the United States with a correlation coefficient (R) of -0.216 and weighted average of 2.1%, a difference of 22.6%.
Vision Disability Correlation Summary
| Measurement | Spanish American Indian | Venezuelan |
| Minimum | 1.4% | 0.36% |
| Maximum | 7.6% | 6.0% |
| Range | 6.2% | 5.6% |
| Mean | 3.0% | 2.1% |
| Median | 2.7% | 2.0% |
| Interquartile 25% (IQ1) | 2.3% | 1.5% |
| Interquartile 75% (IQ3) | 3.1% | 2.3% |
| Interquartile Range (IQR) | 0.83% | 0.73% |
| Standard Deviation (Sample) | 1.4% | 0.94% |
| Standard Deviation (Population) | 1.3% | 0.94% |
Similar Demographics by Vision Disability
Demographics Similar to Spanish American Indians by Vision Disability
In terms of vision disability, the demographic groups most similar to Spanish American Indians are Immigrants from Cabo Verde (2.6%, a difference of 0.22%), Aleut (2.6%, a difference of 0.36%), Hispanic or Latino (2.6%, a difference of 0.66%), Menominee (2.5%, a difference of 1.3%), and Iroquois (2.6%, a difference of 1.3%).
| Demographics | Rating | Rank | Vision Disability |
| Delaware | 0.0 /100 | #295 | Tragic 2.5% |
| Immigrants | Mexico | 0.0 /100 | #296 | Tragic 2.5% |
| Immigrants | Dominica | 0.0 /100 | #297 | Tragic 2.5% |
| Mexicans | 0.0 /100 | #298 | Tragic 2.5% |
| Cree | 0.0 /100 | #299 | Tragic 2.5% |
| Africans | 0.0 /100 | #300 | Tragic 2.5% |
| Menominee | 0.0 /100 | #301 | Tragic 2.5% |
| Spanish American Indians | 0.0 /100 | #302 | Tragic 2.6% |
| Immigrants | Cabo Verde | 0.0 /100 | #303 | Tragic 2.6% |
| Aleuts | 0.0 /100 | #304 | Tragic 2.6% |
| Hispanics or Latinos | 0.0 /100 | #305 | Tragic 2.6% |
| Iroquois | 0.0 /100 | #306 | Tragic 2.6% |
| Immigrants | Dominican Republic | 0.0 /100 | #307 | Tragic 2.6% |
| Arapaho | 0.0 /100 | #308 | Tragic 2.6% |
| Immigrants | Yemen | 0.0 /100 | #309 | Tragic 2.6% |
Demographics Similar to Venezuelans by Vision Disability
In terms of vision disability, the demographic groups most similar to Venezuelans are Syrian (2.1%, a difference of 0.050%), Vietnamese (2.1%, a difference of 0.070%), Czech (2.1%, a difference of 0.12%), Immigrants from South Eastern Asia (2.1%, a difference of 0.12%), and Arab (2.1%, a difference of 0.13%).
| Demographics | Rating | Rank | Vision Disability |
| Sudanese | 89.2 /100 | #127 | Excellent 2.1% |
| Immigrants | Chile | 89.0 /100 | #128 | Excellent 2.1% |
| Immigrants | Cameroon | 88.8 /100 | #129 | Excellent 2.1% |
| Immigrants | Kenya | 88.7 /100 | #130 | Excellent 2.1% |
| Immigrants | Hungary | 88.7 /100 | #131 | Excellent 2.1% |
| New Zealanders | 88.2 /100 | #132 | Excellent 2.1% |
| Syrians | 87.5 /100 | #133 | Excellent 2.1% |
| Venezuelans | 87.2 /100 | #134 | Excellent 2.1% |
| Vietnamese | 86.7 /100 | #135 | Excellent 2.1% |
| Czechs | 86.3 /100 | #136 | Excellent 2.1% |
| Immigrants | South Eastern Asia | 86.3 /100 | #137 | Excellent 2.1% |
| Arabs | 86.3 /100 | #138 | Excellent 2.1% |
| Immigrants | Morocco | 85.2 /100 | #139 | Excellent 2.1% |
| Immigrants | Netherlands | 84.2 /100 | #140 | Excellent 2.1% |
| Sierra Leoneans | 84.1 /100 | #141 | Excellent 2.1% |