Irish vs Venezuelan Vision Disability
COMPARE
Irish
Venezuelan
Vision Disability
Vision Disability Comparison
Irish
Venezuelans
2.3%
VISION DISABILITY
3.4/ 100
METRIC RATING
224th/ 347
METRIC RANK
2.1%
VISION DISABILITY
87.2/ 100
METRIC RATING
134th/ 347
METRIC RANK
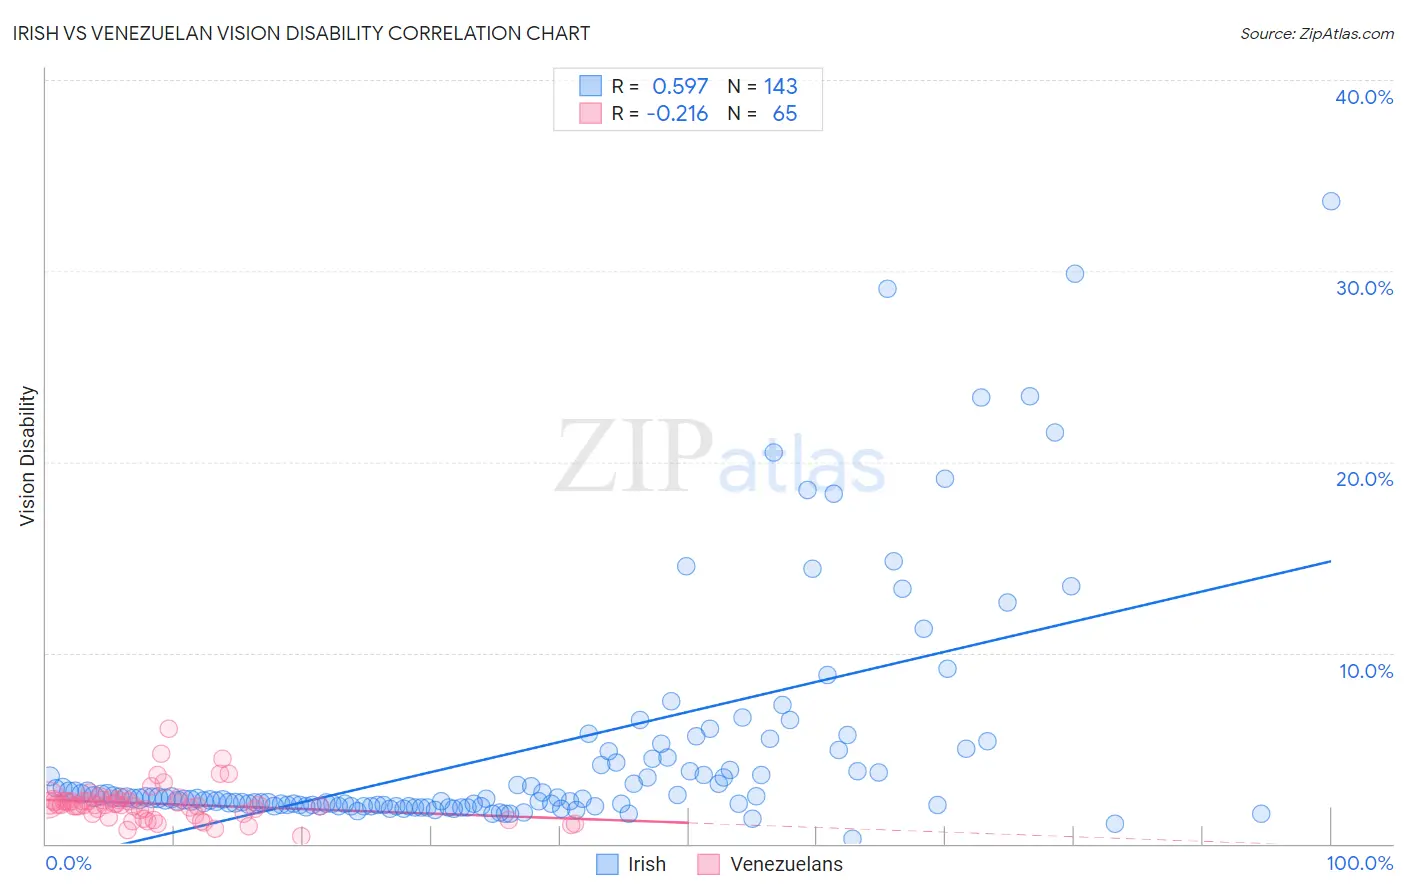
Irish vs Venezuelan Vision Disability Correlation Chart
The statistical analysis conducted on geographies consisting of 577,659,989 people shows a substantial positive correlation between the proportion of Irish and percentage of population with vision disability in the United States with a correlation coefficient (R) of 0.597 and weighted average of 2.3%. Similarly, the statistical analysis conducted on geographies consisting of 306,200,633 people shows a weak negative correlation between the proportion of Venezuelans and percentage of population with vision disability in the United States with a correlation coefficient (R) of -0.216 and weighted average of 2.1%, a difference of 8.5%.
Vision Disability Correlation Summary
| Measurement | Irish | Venezuelan |
| Minimum | 0.27% | 0.36% |
| Maximum | 33.6% | 6.0% |
| Range | 33.4% | 5.6% |
| Mean | 4.9% | 2.1% |
| Median | 2.4% | 2.0% |
| Interquartile 25% (IQ1) | 2.0% | 1.5% |
| Interquartile 75% (IQ3) | 4.4% | 2.3% |
| Interquartile Range (IQR) | 2.4% | 0.73% |
| Standard Deviation (Sample) | 6.0% | 0.94% |
| Standard Deviation (Population) | 6.0% | 0.94% |
Similar Demographics by Vision Disability
Demographics Similar to Irish by Vision Disability
In terms of vision disability, the demographic groups most similar to Irish are Immigrants from Western Africa (2.3%, a difference of 0.010%), Basque (2.3%, a difference of 0.020%), Immigrants from Senegal (2.3%, a difference of 0.17%), French Canadian (2.3%, a difference of 0.19%), and Guamanian/Chamorro (2.3%, a difference of 0.20%).
| Demographics | Rating | Rank | Vision Disability |
| Barbadians | 5.1 /100 | #217 | Tragic 2.3% |
| Portuguese | 4.9 /100 | #218 | Tragic 2.3% |
| Ecuadorians | 4.6 /100 | #219 | Tragic 2.3% |
| Guamanians/Chamorros | 3.9 /100 | #220 | Tragic 2.3% |
| French Canadians | 3.9 /100 | #221 | Tragic 2.3% |
| Immigrants | Senegal | 3.8 /100 | #222 | Tragic 2.3% |
| Basques | 3.5 /100 | #223 | Tragic 2.3% |
| Irish | 3.4 /100 | #224 | Tragic 2.3% |
| Immigrants | Western Africa | 3.4 /100 | #225 | Tragic 2.3% |
| Immigrants | Germany | 3.0 /100 | #226 | Tragic 2.3% |
| Hawaiians | 2.9 /100 | #227 | Tragic 2.3% |
| Hmong | 2.5 /100 | #228 | Tragic 2.3% |
| Welsh | 2.3 /100 | #229 | Tragic 2.3% |
| Nicaraguans | 2.2 /100 | #230 | Tragic 2.3% |
| Immigrants | Ecuador | 2.0 /100 | #231 | Tragic 2.3% |
Demographics Similar to Venezuelans by Vision Disability
In terms of vision disability, the demographic groups most similar to Venezuelans are Syrian (2.1%, a difference of 0.050%), Vietnamese (2.1%, a difference of 0.070%), Czech (2.1%, a difference of 0.12%), Immigrants from South Eastern Asia (2.1%, a difference of 0.12%), and Arab (2.1%, a difference of 0.13%).
| Demographics | Rating | Rank | Vision Disability |
| Sudanese | 89.2 /100 | #127 | Excellent 2.1% |
| Immigrants | Chile | 89.0 /100 | #128 | Excellent 2.1% |
| Immigrants | Cameroon | 88.8 /100 | #129 | Excellent 2.1% |
| Immigrants | Kenya | 88.7 /100 | #130 | Excellent 2.1% |
| Immigrants | Hungary | 88.7 /100 | #131 | Excellent 2.1% |
| New Zealanders | 88.2 /100 | #132 | Excellent 2.1% |
| Syrians | 87.5 /100 | #133 | Excellent 2.1% |
| Venezuelans | 87.2 /100 | #134 | Excellent 2.1% |
| Vietnamese | 86.7 /100 | #135 | Excellent 2.1% |
| Czechs | 86.3 /100 | #136 | Excellent 2.1% |
| Immigrants | South Eastern Asia | 86.3 /100 | #137 | Excellent 2.1% |
| Arabs | 86.3 /100 | #138 | Excellent 2.1% |
| Immigrants | Morocco | 85.2 /100 | #139 | Excellent 2.1% |
| Immigrants | Netherlands | 84.2 /100 | #140 | Excellent 2.1% |
| Sierra Leoneans | 84.1 /100 | #141 | Excellent 2.1% |