Lumbee vs Indian (Asian) 2nd Grade
COMPARE
Lumbee
Indian (Asian)
2nd Grade
2nd Grade Comparison
Lumbee
Indians (Asian)
98.4%
2ND GRADE
99.9/ 100
METRIC RATING
46th/ 347
METRIC RANK
97.5%
2ND GRADE
0.6/ 100
METRIC RATING
254th/ 347
METRIC RANK
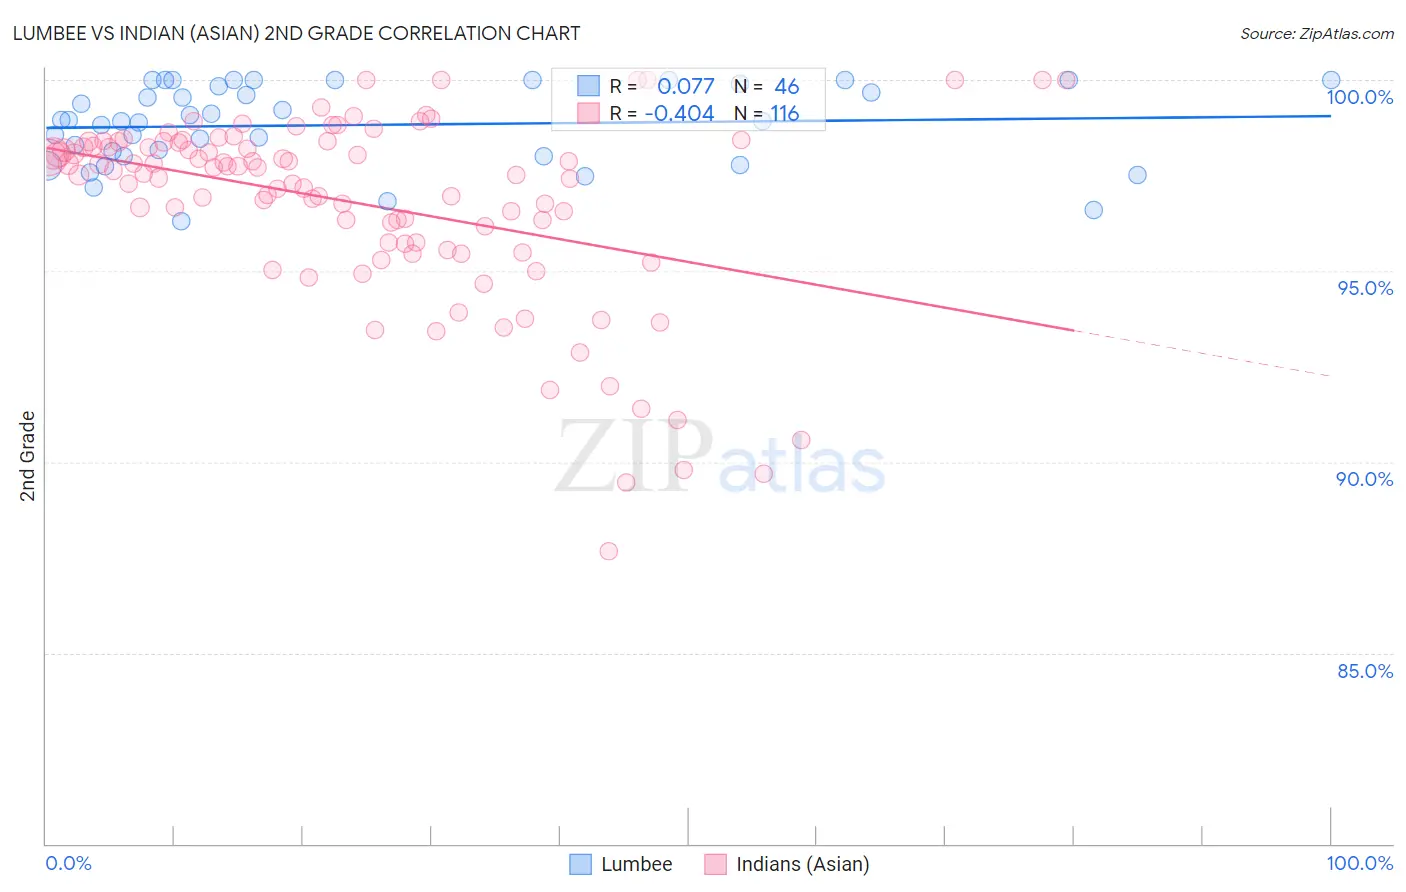
Lumbee vs Indian (Asian) 2nd Grade Correlation Chart
The statistical analysis conducted on geographies consisting of 92,298,794 people shows a slight positive correlation between the proportion of Lumbee and percentage of population with at least 2nd grade education in the United States with a correlation coefficient (R) of 0.077 and weighted average of 98.4%. Similarly, the statistical analysis conducted on geographies consisting of 495,287,818 people shows a moderate negative correlation between the proportion of Indians (Asian) and percentage of population with at least 2nd grade education in the United States with a correlation coefficient (R) of -0.404 and weighted average of 97.5%, a difference of 0.94%.
2nd Grade Correlation Summary
| Measurement | Lumbee | Indian (Asian) |
| Minimum | 96.3% | 87.6% |
| Maximum | 100.0% | 100.0% |
| Range | 3.7% | 12.4% |
| Mean | 98.8% | 96.8% |
| Median | 98.9% | 97.6% |
| Interquartile 25% (IQ1) | 98.0% | 95.7% |
| Interquartile 75% (IQ3) | 99.9% | 98.4% |
| Interquartile Range (IQR) | 1.9% | 2.6% |
| Standard Deviation (Sample) | 1.1% | 2.5% |
| Standard Deviation (Population) | 1.0% | 2.5% |
Similar Demographics by 2nd Grade
Demographics Similar to Lumbee by 2nd Grade
In terms of 2nd grade, the demographic groups most similar to Lumbee are Hungarian (98.4%, a difference of 0.010%), Ottawa (98.4%, a difference of 0.010%), Czechoslovakian (98.4%, a difference of 0.010%), Northern European (98.4%, a difference of 0.020%), and Native Hawaiian (98.4%, a difference of 0.030%).
| Demographics | Rating | Rank | 2nd Grade |
| Chippewa | 99.9 /100 | #39 | Exceptional 98.4% |
| Luxembourgers | 99.9 /100 | #40 | Exceptional 98.4% |
| Eastern Europeans | 99.9 /100 | #41 | Exceptional 98.4% |
| Native Hawaiians | 99.9 /100 | #42 | Exceptional 98.4% |
| Belgians | 99.9 /100 | #43 | Exceptional 98.4% |
| Northern Europeans | 99.9 /100 | #44 | Exceptional 98.4% |
| Hungarians | 99.9 /100 | #45 | Exceptional 98.4% |
| Lumbee | 99.9 /100 | #46 | Exceptional 98.4% |
| Ottawa | 99.9 /100 | #47 | Exceptional 98.4% |
| Czechoslovakians | 99.9 /100 | #48 | Exceptional 98.4% |
| Celtics | 99.8 /100 | #49 | Exceptional 98.4% |
| Whites/Caucasians | 99.8 /100 | #50 | Exceptional 98.4% |
| Estonians | 99.8 /100 | #51 | Exceptional 98.4% |
| Australians | 99.8 /100 | #52 | Exceptional 98.4% |
| Pueblo | 99.8 /100 | #53 | Exceptional 98.3% |
Demographics Similar to Indians (Asian) by 2nd Grade
In terms of 2nd grade, the demographic groups most similar to Indians (Asian) are Immigrants from Congo (97.5%, a difference of 0.0%), Jamaican (97.5%, a difference of 0.0%), Immigrants from Asia (97.5%, a difference of 0.010%), Puerto Rican (97.5%, a difference of 0.010%), and Immigrants from Colombia (97.5%, a difference of 0.010%).
| Demographics | Rating | Rank | 2nd Grade |
| Immigrants | Senegal | 0.9 /100 | #247 | Tragic 97.5% |
| Immigrants | Middle Africa | 0.9 /100 | #248 | Tragic 97.5% |
| Bolivians | 0.9 /100 | #249 | Tragic 97.5% |
| Peruvians | 0.9 /100 | #250 | Tragic 97.5% |
| Immigrants | Africa | 0.8 /100 | #251 | Tragic 97.5% |
| Immigrants | Asia | 0.7 /100 | #252 | Tragic 97.5% |
| Puerto Ricans | 0.7 /100 | #253 | Tragic 97.5% |
| Indians (Asian) | 0.6 /100 | #254 | Tragic 97.5% |
| Immigrants | Congo | 0.6 /100 | #255 | Tragic 97.5% |
| Jamaicans | 0.6 /100 | #256 | Tragic 97.5% |
| Immigrants | Colombia | 0.5 /100 | #257 | Tragic 97.5% |
| Yaqui | 0.5 /100 | #258 | Tragic 97.5% |
| Fijians | 0.5 /100 | #259 | Tragic 97.5% |
| Assyrians/Chaldeans/Syriacs | 0.5 /100 | #260 | Tragic 97.5% |
| Armenians | 0.5 /100 | #261 | Tragic 97.5% |