Lumbee vs Assyrian/Chaldean/Syriac Disability Age Over 75
COMPARE
Lumbee
Assyrian/Chaldean/Syriac
Disability Age Over 75
Disability Age Over 75 Comparison
Lumbee
Assyrians/Chaldeans/Syriacs
56.2%
DISABILITY AGE OVER 75
0.0/ 100
METRIC RATING
342nd/ 347
METRIC RANK
49.1%
DISABILITY AGE OVER 75
0.2/ 100
METRIC RATING
272nd/ 347
METRIC RANK
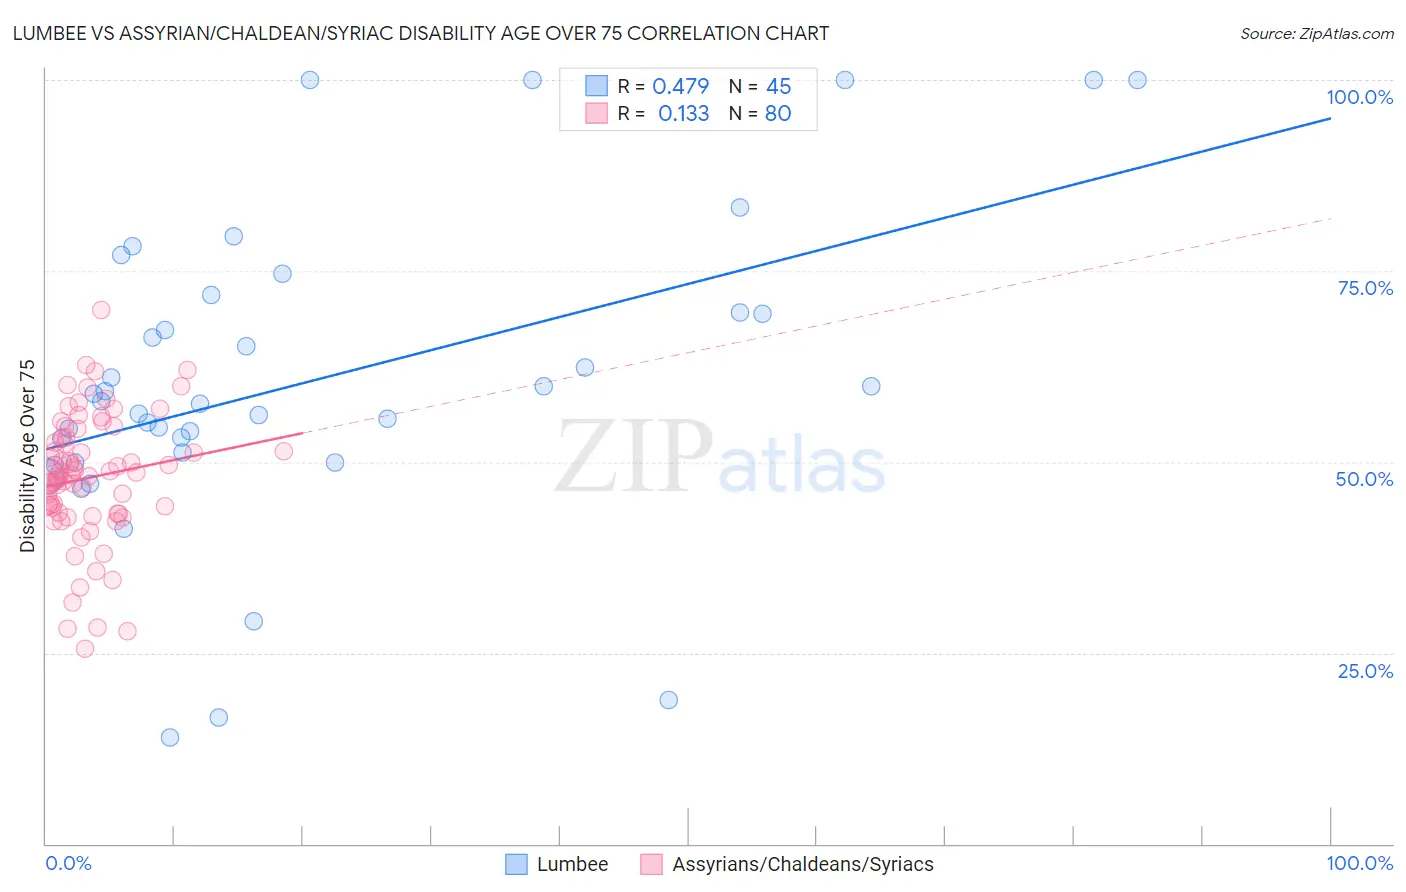
Lumbee vs Assyrian/Chaldean/Syriac Disability Age Over 75 Correlation Chart
The statistical analysis conducted on geographies consisting of 92,131,949 people shows a moderate positive correlation between the proportion of Lumbee and percentage of population with a disability over the age of 75 in the United States with a correlation coefficient (R) of 0.479 and weighted average of 56.2%. Similarly, the statistical analysis conducted on geographies consisting of 110,272,420 people shows a poor positive correlation between the proportion of Assyrians/Chaldeans/Syriacs and percentage of population with a disability over the age of 75 in the United States with a correlation coefficient (R) of 0.133 and weighted average of 49.1%, a difference of 14.7%.
Disability Age Over 75 Correlation Summary
| Measurement | Lumbee | Assyrian/Chaldean/Syriac |
| Minimum | 13.8% | 25.6% |
| Maximum | 100.0% | 69.9% |
| Range | 86.2% | 44.3% |
| Mean | 60.7% | 47.9% |
| Median | 58.0% | 48.2% |
| Interquartile 25% (IQ1) | 50.6% | 43.3% |
| Interquartile 75% (IQ3) | 70.7% | 53.1% |
| Interquartile Range (IQR) | 20.1% | 9.9% |
| Standard Deviation (Sample) | 20.4% | 8.5% |
| Standard Deviation (Population) | 20.2% | 8.4% |
Similar Demographics by Disability Age Over 75
Demographics Similar to Lumbee by Disability Age Over 75
In terms of disability age over 75, the demographic groups most similar to Lumbee are Houma (56.2%, a difference of 0.16%), Pueblo (55.9%, a difference of 0.67%), Pima (55.8%, a difference of 0.76%), Tohono O'odham (56.7%, a difference of 0.83%), and Colville (55.4%, a difference of 1.6%).
| Demographics | Rating | Rank | Disability Age Over 75 |
| Apache | 0.0 /100 | #333 | Tragic 53.6% |
| Alaskan Athabascans | 0.0 /100 | #334 | Tragic 54.0% |
| Kiowa | 0.0 /100 | #335 | Tragic 54.2% |
| Immigrants | Armenia | 0.0 /100 | #336 | Tragic 54.3% |
| Yuman | 0.0 /100 | #337 | Tragic 54.4% |
| Colville | 0.0 /100 | #338 | Tragic 55.4% |
| Pima | 0.0 /100 | #339 | Tragic 55.8% |
| Pueblo | 0.0 /100 | #340 | Tragic 55.9% |
| Houma | 0.0 /100 | #341 | Tragic 56.2% |
| Lumbee | 0.0 /100 | #342 | Tragic 56.2% |
| Tohono O'odham | 0.0 /100 | #343 | Tragic 56.7% |
| Navajo | 0.0 /100 | #344 | Tragic 58.3% |
| Inupiat | 0.0 /100 | #345 | Tragic 58.4% |
| Tsimshian | 0.0 /100 | #346 | Tragic 59.2% |
| Yup'ik | 0.0 /100 | #347 | Tragic 61.1% |
Demographics Similar to Assyrians/Chaldeans/Syriacs by Disability Age Over 75
In terms of disability age over 75, the demographic groups most similar to Assyrians/Chaldeans/Syriacs are Fijian (49.0%, a difference of 0.010%), Potawatomi (49.0%, a difference of 0.030%), Immigrants from Iraq (49.1%, a difference of 0.050%), Immigrants from El Salvador (49.0%, a difference of 0.060%), and Guatemalan (49.0%, a difference of 0.080%).
| Demographics | Rating | Rank | Disability Age Over 75 |
| Hondurans | 0.3 /100 | #265 | Tragic 48.9% |
| U.S. Virgin Islanders | 0.2 /100 | #266 | Tragic 48.9% |
| Malaysians | 0.2 /100 | #267 | Tragic 49.0% |
| Guatemalans | 0.2 /100 | #268 | Tragic 49.0% |
| Immigrants | El Salvador | 0.2 /100 | #269 | Tragic 49.0% |
| Potawatomi | 0.2 /100 | #270 | Tragic 49.0% |
| Fijians | 0.2 /100 | #271 | Tragic 49.0% |
| Assyrians/Chaldeans/Syriacs | 0.2 /100 | #272 | Tragic 49.1% |
| Immigrants | Iraq | 0.1 /100 | #273 | Tragic 49.1% |
| Immigrants | Guatemala | 0.1 /100 | #274 | Tragic 49.1% |
| Immigrants | Dominica | 0.1 /100 | #275 | Tragic 49.1% |
| Immigrants | Uzbekistan | 0.1 /100 | #276 | Tragic 49.2% |
| Hawaiians | 0.1 /100 | #277 | Tragic 49.2% |
| Immigrants | Laos | 0.1 /100 | #278 | Tragic 49.2% |
| Guamanians/Chamorros | 0.0 /100 | #279 | Tragic 49.4% |