Immigrants from South Central Asia vs Assyrian/Chaldean/Syriac Disability Age Over 75
COMPARE
Immigrants from South Central Asia
Assyrian/Chaldean/Syriac
Disability Age Over 75
Disability Age Over 75 Comparison
Immigrants from South Central Asia
Assyrians/Chaldeans/Syriacs
46.0%
DISABILITY AGE OVER 75
99.4/ 100
METRIC RATING
68th/ 347
METRIC RANK
49.1%
DISABILITY AGE OVER 75
0.2/ 100
METRIC RATING
272nd/ 347
METRIC RANK
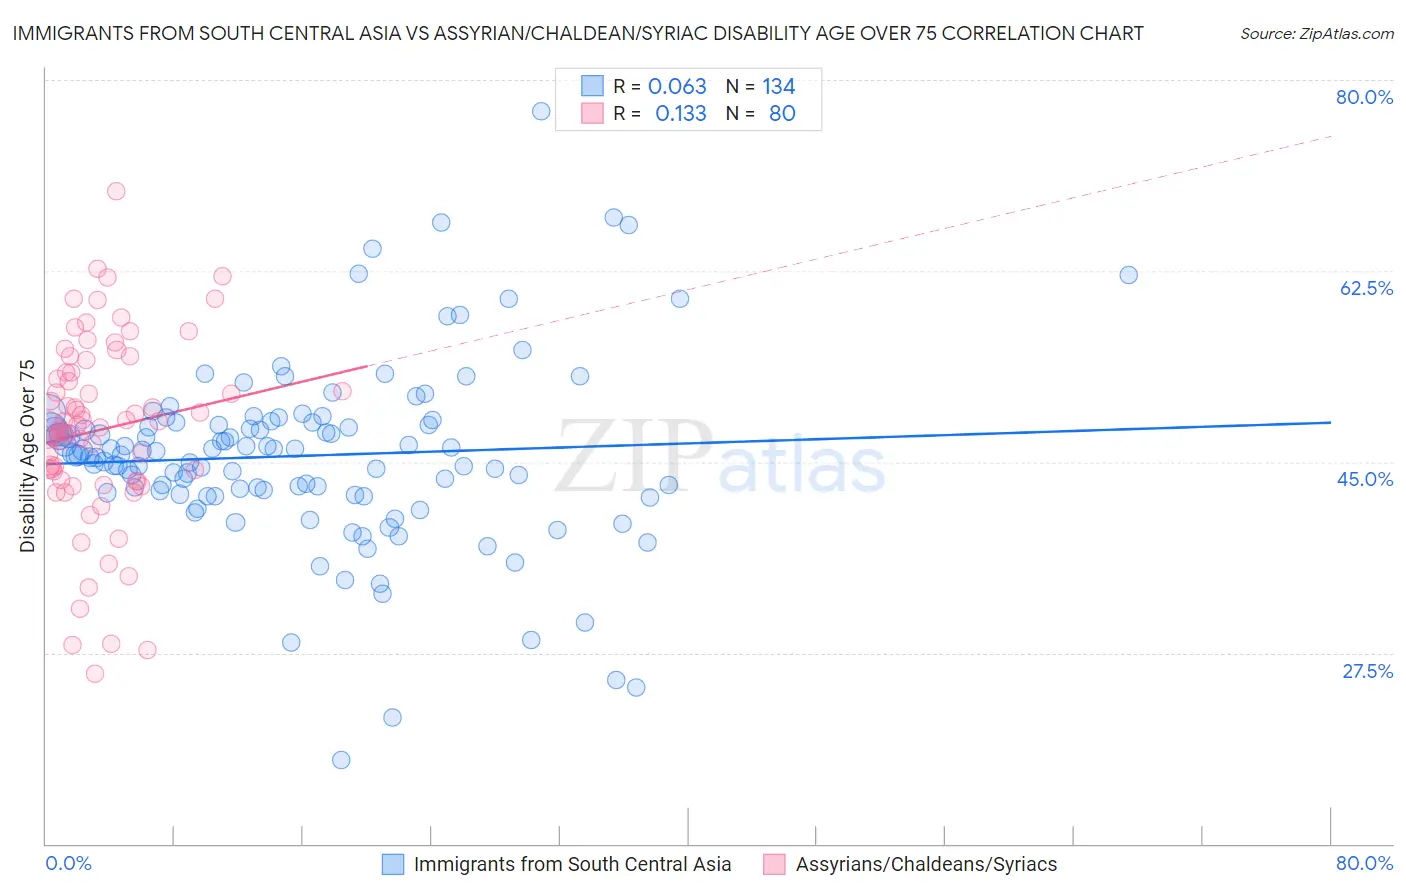
Immigrants from South Central Asia vs Assyrian/Chaldean/Syriac Disability Age Over 75 Correlation Chart
The statistical analysis conducted on geographies consisting of 471,983,818 people shows a slight positive correlation between the proportion of Immigrants from South Central Asia and percentage of population with a disability over the age of 75 in the United States with a correlation coefficient (R) of 0.063 and weighted average of 46.0%. Similarly, the statistical analysis conducted on geographies consisting of 110,272,420 people shows a poor positive correlation between the proportion of Assyrians/Chaldeans/Syriacs and percentage of population with a disability over the age of 75 in the United States with a correlation coefficient (R) of 0.133 and weighted average of 49.1%, a difference of 6.7%.
Disability Age Over 75 Correlation Summary
| Measurement | Immigrants from South Central Asia | Assyrian/Chaldean/Syriac |
| Minimum | 17.6% | 25.6% |
| Maximum | 77.1% | 69.9% |
| Range | 59.4% | 44.3% |
| Mean | 45.6% | 47.9% |
| Median | 45.7% | 48.2% |
| Interquartile 25% (IQ1) | 42.2% | 43.3% |
| Interquartile 75% (IQ3) | 48.6% | 53.1% |
| Interquartile Range (IQR) | 6.4% | 9.9% |
| Standard Deviation (Sample) | 8.4% | 8.5% |
| Standard Deviation (Population) | 8.4% | 8.4% |
Similar Demographics by Disability Age Over 75
Demographics Similar to Immigrants from South Central Asia by Disability Age Over 75
In terms of disability age over 75, the demographic groups most similar to Immigrants from South Central Asia are Immigrants from Spain (46.0%, a difference of 0.040%), Immigrants from Romania (46.0%, a difference of 0.060%), Austrian (46.0%, a difference of 0.070%), Immigrants from England (46.0%, a difference of 0.070%), and Immigrants from Norway (45.9%, a difference of 0.11%).
| Demographics | Rating | Rank | Disability Age Over 75 |
| Immigrants | Argentina | 99.6 /100 | #61 | Exceptional 45.9% |
| Burmese | 99.5 /100 | #62 | Exceptional 45.9% |
| Immigrants | Norway | 99.5 /100 | #63 | Exceptional 45.9% |
| Immigrants | North Macedonia | 99.5 /100 | #64 | Exceptional 45.9% |
| Austrians | 99.5 /100 | #65 | Exceptional 46.0% |
| Immigrants | England | 99.5 /100 | #66 | Exceptional 46.0% |
| Immigrants | Spain | 99.4 /100 | #67 | Exceptional 46.0% |
| Immigrants | South Central Asia | 99.4 /100 | #68 | Exceptional 46.0% |
| Immigrants | Romania | 99.3 /100 | #69 | Exceptional 46.0% |
| Jordanians | 99.2 /100 | #70 | Exceptional 46.1% |
| Immigrants | Sri Lanka | 99.2 /100 | #71 | Exceptional 46.1% |
| Immigrants | Hungary | 99.1 /100 | #72 | Exceptional 46.1% |
| Cambodians | 99.1 /100 | #73 | Exceptional 46.1% |
| Egyptians | 99.0 /100 | #74 | Exceptional 46.1% |
| Serbians | 99.0 /100 | #75 | Exceptional 46.1% |
Demographics Similar to Assyrians/Chaldeans/Syriacs by Disability Age Over 75
In terms of disability age over 75, the demographic groups most similar to Assyrians/Chaldeans/Syriacs are Fijian (49.0%, a difference of 0.010%), Potawatomi (49.0%, a difference of 0.030%), Immigrants from Iraq (49.1%, a difference of 0.050%), Immigrants from El Salvador (49.0%, a difference of 0.060%), and Guatemalan (49.0%, a difference of 0.080%).
| Demographics | Rating | Rank | Disability Age Over 75 |
| Hondurans | 0.3 /100 | #265 | Tragic 48.9% |
| U.S. Virgin Islanders | 0.2 /100 | #266 | Tragic 48.9% |
| Malaysians | 0.2 /100 | #267 | Tragic 49.0% |
| Guatemalans | 0.2 /100 | #268 | Tragic 49.0% |
| Immigrants | El Salvador | 0.2 /100 | #269 | Tragic 49.0% |
| Potawatomi | 0.2 /100 | #270 | Tragic 49.0% |
| Fijians | 0.2 /100 | #271 | Tragic 49.0% |
| Assyrians/Chaldeans/Syriacs | 0.2 /100 | #272 | Tragic 49.1% |
| Immigrants | Iraq | 0.1 /100 | #273 | Tragic 49.1% |
| Immigrants | Guatemala | 0.1 /100 | #274 | Tragic 49.1% |
| Immigrants | Dominica | 0.1 /100 | #275 | Tragic 49.1% |
| Immigrants | Uzbekistan | 0.1 /100 | #276 | Tragic 49.2% |
| Hawaiians | 0.1 /100 | #277 | Tragic 49.2% |
| Immigrants | Laos | 0.1 /100 | #278 | Tragic 49.2% |
| Guamanians/Chamorros | 0.0 /100 | #279 | Tragic 49.4% |