Lithuanian vs Immigrants from Uganda Master's Degree
COMPARE
Lithuanian
Immigrants from Uganda
Master's Degree
Master's Degree Comparison
Lithuanians
Immigrants from Uganda
17.7%
MASTER'S DEGREE
99.7/ 100
METRIC RATING
72nd/ 347
METRIC RANK
16.6%
MASTER'S DEGREE
97.3/ 100
METRIC RATING
115th/ 347
METRIC RANK
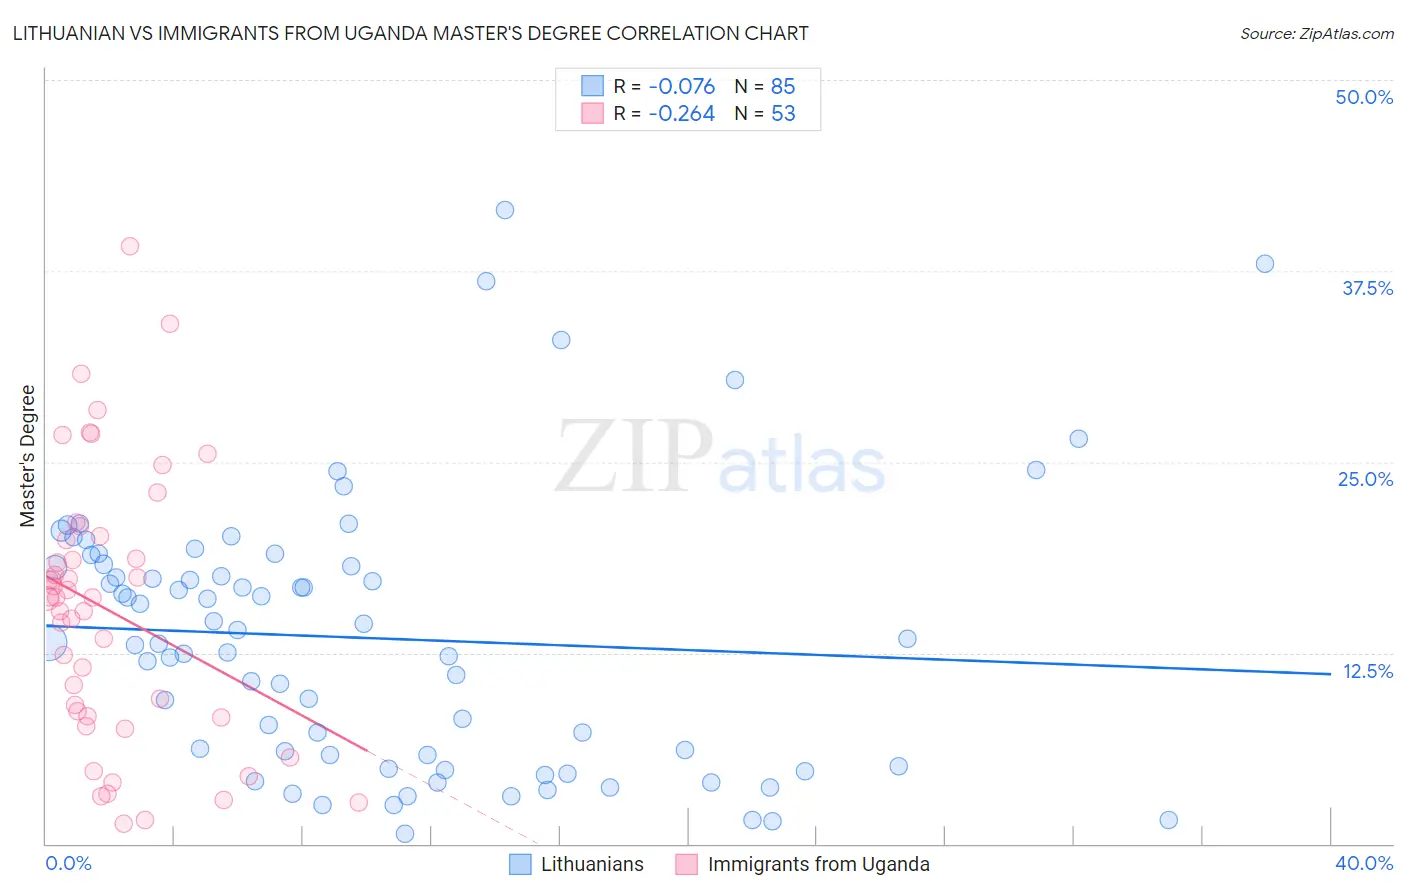
Lithuanian vs Immigrants from Uganda Master's Degree Correlation Chart
The statistical analysis conducted on geographies consisting of 421,813,641 people shows a slight negative correlation between the proportion of Lithuanians and percentage of population with at least master's degree education in the United States with a correlation coefficient (R) of -0.076 and weighted average of 17.7%. Similarly, the statistical analysis conducted on geographies consisting of 125,956,519 people shows a weak negative correlation between the proportion of Immigrants from Uganda and percentage of population with at least master's degree education in the United States with a correlation coefficient (R) of -0.264 and weighted average of 16.6%, a difference of 6.6%.
Master's Degree Correlation Summary
| Measurement | Lithuanian | Immigrants from Uganda |
| Minimum | 0.63% | 1.3% |
| Maximum | 41.5% | 39.1% |
| Range | 40.9% | 37.8% |
| Mean | 13.5% | 15.3% |
| Median | 13.2% | 16.1% |
| Interquartile 25% (IQ1) | 5.4% | 8.3% |
| Interquartile 75% (IQ3) | 18.2% | 20.0% |
| Interquartile Range (IQR) | 12.8% | 11.7% |
| Standard Deviation (Sample) | 8.8% | 8.7% |
| Standard Deviation (Population) | 8.7% | 8.7% |
Similar Demographics by Master's Degree
Demographics Similar to Lithuanians by Master's Degree
In terms of master's degree, the demographic groups most similar to Lithuanians are Zimbabwean (17.7%, a difference of 0.11%), Immigrants from Pakistan (17.8%, a difference of 0.17%), Immigrants from Romania (17.7%, a difference of 0.41%), Immigrants from Western Europe (17.8%, a difference of 0.46%), and Immigrants from Uzbekistan (17.9%, a difference of 0.67%).
| Demographics | Rating | Rank | Master's Degree |
| Immigrants | Kazakhstan | 99.8 /100 | #65 | Exceptional 18.0% |
| Ethiopians | 99.8 /100 | #66 | Exceptional 18.0% |
| Immigrants | Argentina | 99.8 /100 | #67 | Exceptional 18.0% |
| Immigrants | Ethiopia | 99.8 /100 | #68 | Exceptional 17.9% |
| Immigrants | Uzbekistan | 99.8 /100 | #69 | Exceptional 17.9% |
| Immigrants | Western Europe | 99.8 /100 | #70 | Exceptional 17.8% |
| Immigrants | Pakistan | 99.7 /100 | #71 | Exceptional 17.8% |
| Lithuanians | 99.7 /100 | #72 | Exceptional 17.7% |
| Zimbabweans | 99.7 /100 | #73 | Exceptional 17.7% |
| Immigrants | Romania | 99.7 /100 | #74 | Exceptional 17.7% |
| Egyptians | 99.6 /100 | #75 | Exceptional 17.6% |
| Immigrants | Indonesia | 99.6 /100 | #76 | Exceptional 17.6% |
| Immigrants | Eastern Europe | 99.6 /100 | #77 | Exceptional 17.6% |
| Immigrants | Hungary | 99.6 /100 | #78 | Exceptional 17.5% |
| Immigrants | Lebanon | 99.6 /100 | #79 | Exceptional 17.5% |
Demographics Similar to Immigrants from Uganda by Master's Degree
In terms of master's degree, the demographic groups most similar to Immigrants from Uganda are Immigrants from Southern Europe (16.6%, a difference of 0.12%), Immigrants from Moldova (16.6%, a difference of 0.13%), Northern European (16.7%, a difference of 0.30%), Arab (16.7%, a difference of 0.37%), and Macedonian (16.7%, a difference of 0.38%).
| Demographics | Rating | Rank | Master's Degree |
| Sierra Leoneans | 98.0 /100 | #108 | Exceptional 16.8% |
| Moroccans | 98.0 /100 | #109 | Exceptional 16.8% |
| Immigrants | Chile | 98.0 /100 | #110 | Exceptional 16.8% |
| Austrians | 97.8 /100 | #111 | Exceptional 16.7% |
| Macedonians | 97.7 /100 | #112 | Exceptional 16.7% |
| Arabs | 97.7 /100 | #113 | Exceptional 16.7% |
| Northern Europeans | 97.6 /100 | #114 | Exceptional 16.7% |
| Immigrants | Uganda | 97.3 /100 | #115 | Exceptional 16.6% |
| Immigrants | Southern Europe | 97.2 /100 | #116 | Exceptional 16.6% |
| Immigrants | Moldova | 97.2 /100 | #117 | Exceptional 16.6% |
| Brazilians | 96.8 /100 | #118 | Exceptional 16.5% |
| Jordanians | 96.5 /100 | #119 | Exceptional 16.5% |
| Lebanese | 96.4 /100 | #120 | Exceptional 16.5% |
| Afghans | 96.2 /100 | #121 | Exceptional 16.5% |
| British | 95.6 /100 | #122 | Exceptional 16.4% |