Lithuanian vs Canadian Male Disability
COMPARE
Lithuanian
Canadian
Male Disability
Male Disability Comparison
Lithuanians
Canadians
11.6%
MALE DISABILITY
6.6/ 100
METRIC RATING
214th/ 347
METRIC RANK
12.2%
MALE DISABILITY
0.2/ 100
METRIC RATING
263rd/ 347
METRIC RANK
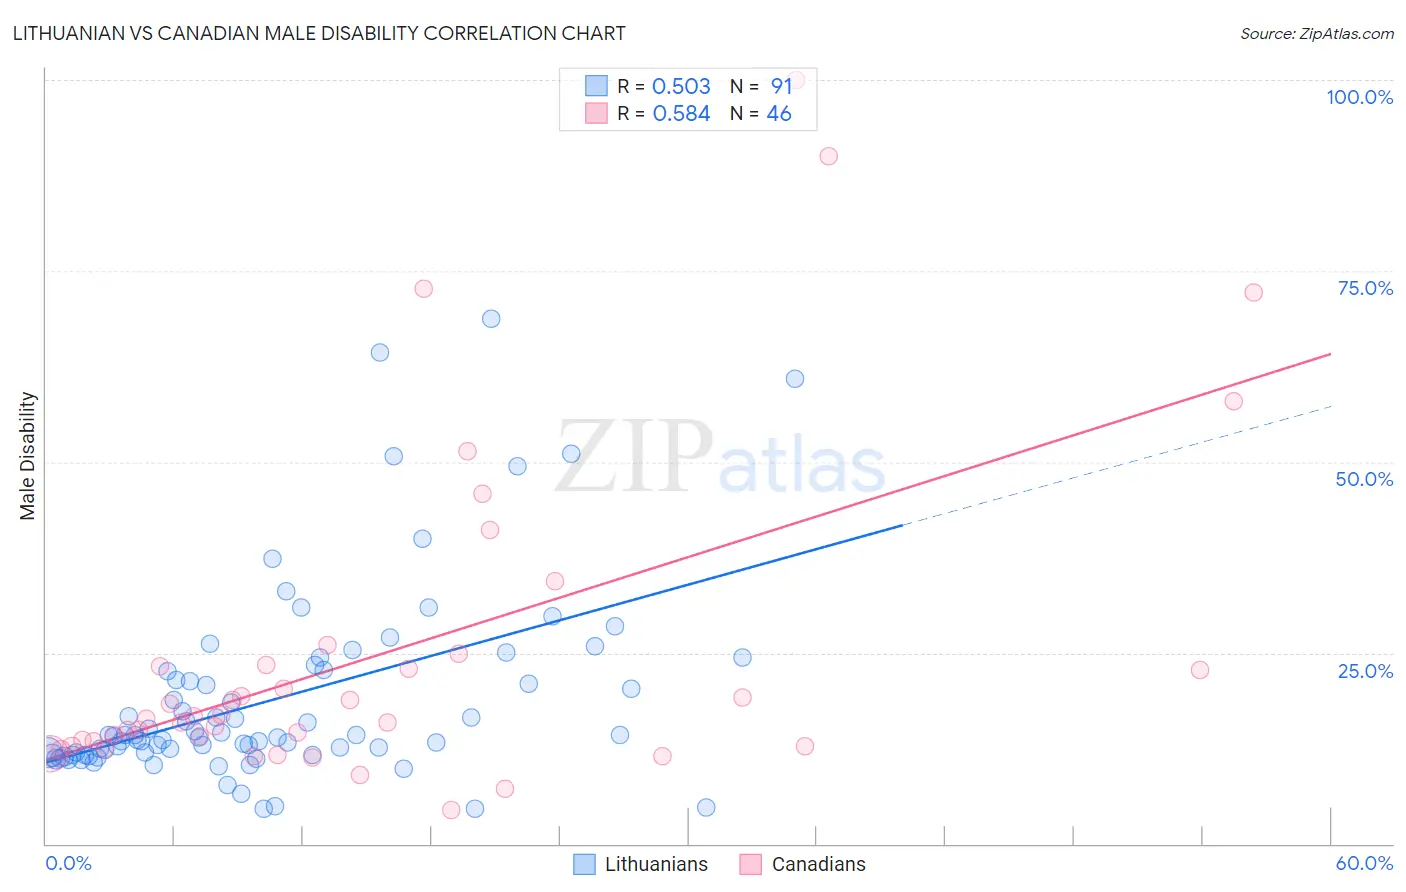
Lithuanian vs Canadian Male Disability Correlation Chart
The statistical analysis conducted on geographies consisting of 421,914,182 people shows a substantial positive correlation between the proportion of Lithuanians and percentage of males with a disability in the United States with a correlation coefficient (R) of 0.503 and weighted average of 11.6%. Similarly, the statistical analysis conducted on geographies consisting of 437,467,484 people shows a substantial positive correlation between the proportion of Canadians and percentage of males with a disability in the United States with a correlation coefficient (R) of 0.584 and weighted average of 12.2%, a difference of 4.9%.
Male Disability Correlation Summary
| Measurement | Lithuanian | Canadian |
| Minimum | 4.5% | 4.4% |
| Maximum | 68.7% | 100.0% |
| Range | 64.1% | 95.6% |
| Mean | 18.8% | 25.0% |
| Median | 14.1% | 16.5% |
| Interquartile 25% (IQ1) | 11.6% | 12.7% |
| Interquartile 75% (IQ3) | 22.5% | 23.4% |
| Interquartile Range (IQR) | 10.9% | 10.7% |
| Standard Deviation (Sample) | 12.6% | 21.6% |
| Standard Deviation (Population) | 12.5% | 21.3% |
Similar Demographics by Male Disability
Demographics Similar to Lithuanians by Male Disability
In terms of male disability, the demographic groups most similar to Lithuanians are Indonesian (11.6%, a difference of 0.16%), Mexican American Indian (11.6%, a difference of 0.24%), Immigrants from Scotland (11.6%, a difference of 0.32%), Immigrants from Thailand (11.6%, a difference of 0.35%), and Immigrants from Dominican Republic (11.7%, a difference of 0.44%).
| Demographics | Rating | Rank | Male Disability |
| Immigrants | Somalia | 10.4 /100 | #207 | Poor 11.5% |
| Icelanders | 10.1 /100 | #208 | Poor 11.6% |
| Spanish American Indians | 10.1 /100 | #209 | Poor 11.6% |
| Ute | 9.4 /100 | #210 | Tragic 11.6% |
| Immigrants | Thailand | 8.4 /100 | #211 | Tragic 11.6% |
| Immigrants | Scotland | 8.2 /100 | #212 | Tragic 11.6% |
| Mexican American Indians | 7.8 /100 | #213 | Tragic 11.6% |
| Lithuanians | 6.6 /100 | #214 | Tragic 11.6% |
| Indonesians | 5.9 /100 | #215 | Tragic 11.6% |
| Immigrants | Dominican Republic | 4.9 /100 | #216 | Tragic 11.7% |
| Immigrants | Dominica | 4.6 /100 | #217 | Tragic 11.7% |
| Immigrants | England | 4.0 /100 | #218 | Tragic 11.7% |
| Panamanians | 3.8 /100 | #219 | Tragic 11.7% |
| Immigrants | Western Europe | 3.8 /100 | #220 | Tragic 11.7% |
| Immigrants | Congo | 3.7 /100 | #221 | Tragic 11.7% |
Demographics Similar to Canadians by Male Disability
In terms of male disability, the demographic groups most similar to Canadians are Nepalese (12.2%, a difference of 0.030%), Norwegian (12.2%, a difference of 0.20%), Slavic (12.2%, a difference of 0.21%), Immigrants from Portugal (12.3%, a difference of 0.49%), and Hawaiian (12.3%, a difference of 0.51%).
| Demographics | Rating | Rank | Male Disability |
| Swiss | 0.3 /100 | #256 | Tragic 12.1% |
| Europeans | 0.3 /100 | #257 | Tragic 12.1% |
| Basques | 0.3 /100 | #258 | Tragic 12.1% |
| Belgians | 0.3 /100 | #259 | Tragic 12.1% |
| Swedes | 0.3 /100 | #260 | Tragic 12.1% |
| Slavs | 0.2 /100 | #261 | Tragic 12.2% |
| Norwegians | 0.2 /100 | #262 | Tragic 12.2% |
| Canadians | 0.2 /100 | #263 | Tragic 12.2% |
| Nepalese | 0.2 /100 | #264 | Tragic 12.2% |
| Immigrants | Portugal | 0.1 /100 | #265 | Tragic 12.3% |
| Hawaiians | 0.1 /100 | #266 | Tragic 12.3% |
| Immigrants | Germany | 0.1 /100 | #267 | Tragic 12.3% |
| Portuguese | 0.1 /100 | #268 | Tragic 12.3% |
| Czechoslovakians | 0.1 /100 | #269 | Tragic 12.3% |
| Spaniards | 0.1 /100 | #270 | Tragic 12.3% |