Lithuanian vs Immigrants from Iraq Ambulatory Disability
COMPARE
Lithuanian
Immigrants from Iraq
Ambulatory Disability
Ambulatory Disability Comparison
Lithuanians
Immigrants from Iraq
6.0%
AMBULATORY DISABILITY
81.9/ 100
METRIC RATING
149th/ 347
METRIC RANK
6.3%
AMBULATORY DISABILITY
14.0/ 100
METRIC RATING
209th/ 347
METRIC RANK
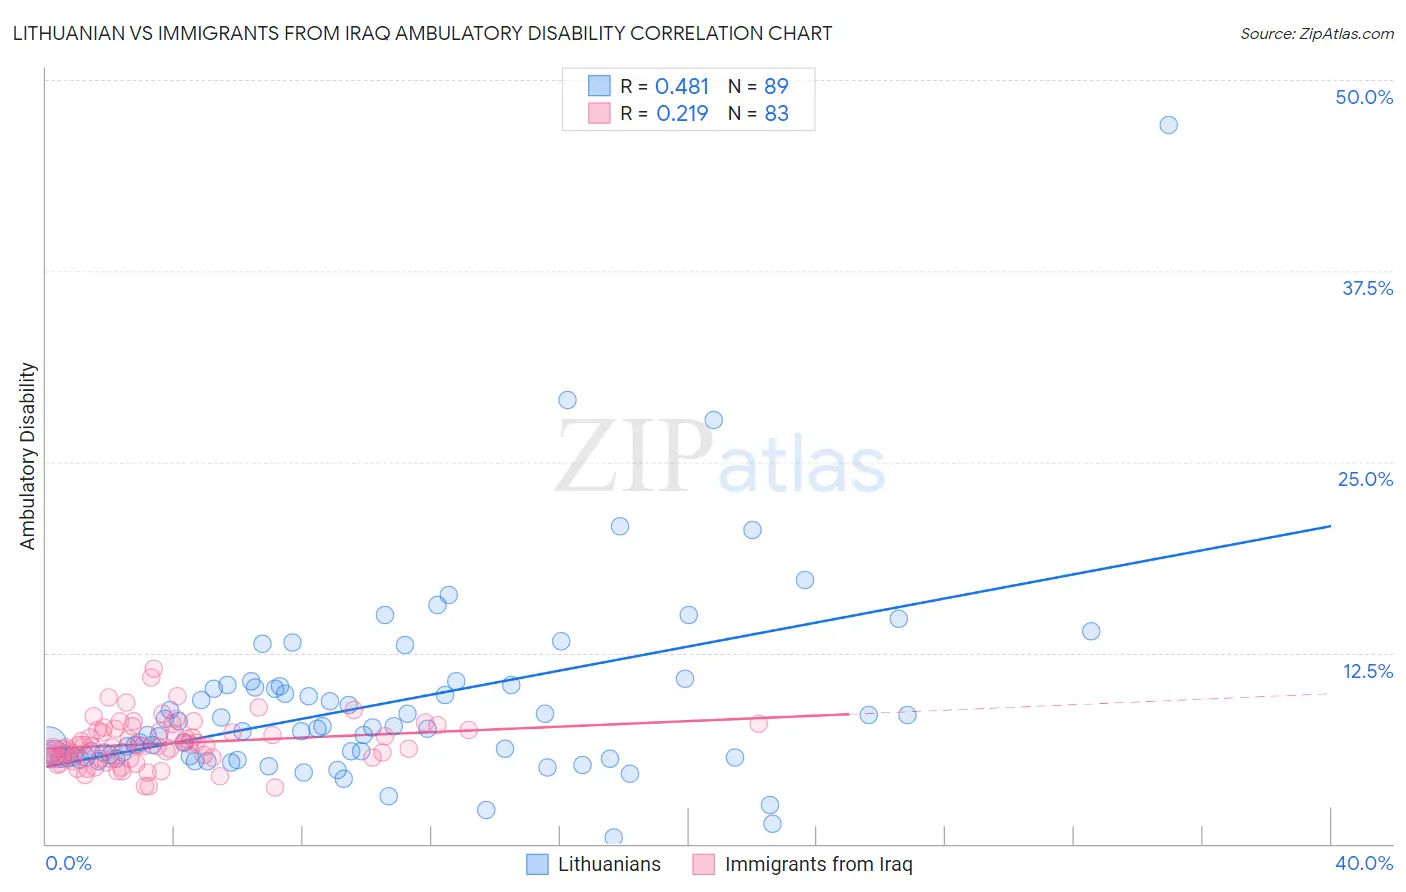
Lithuanian vs Immigrants from Iraq Ambulatory Disability Correlation Chart
The statistical analysis conducted on geographies consisting of 421,829,236 people shows a moderate positive correlation between the proportion of Lithuanians and percentage of population with ambulatory disability in the United States with a correlation coefficient (R) of 0.481 and weighted average of 6.0%. Similarly, the statistical analysis conducted on geographies consisting of 194,765,362 people shows a weak positive correlation between the proportion of Immigrants from Iraq and percentage of population with ambulatory disability in the United States with a correlation coefficient (R) of 0.219 and weighted average of 6.3%, a difference of 4.5%.
Ambulatory Disability Correlation Summary
| Measurement | Lithuanian | Immigrants from Iraq |
| Minimum | 0.40% | 3.7% |
| Maximum | 47.1% | 11.5% |
| Range | 46.7% | 7.8% |
| Mean | 9.0% | 6.6% |
| Median | 7.4% | 6.4% |
| Interquartile 25% (IQ1) | 5.7% | 5.6% |
| Interquartile 75% (IQ3) | 10.3% | 7.4% |
| Interquartile Range (IQR) | 4.6% | 1.9% |
| Standard Deviation (Sample) | 6.3% | 1.5% |
| Standard Deviation (Population) | 6.3% | 1.5% |
Similar Demographics by Ambulatory Disability
Demographics Similar to Lithuanians by Ambulatory Disability
In terms of ambulatory disability, the demographic groups most similar to Lithuanians are Immigrants from Eastern Europe (6.0%, a difference of 0.010%), Maltese (6.0%, a difference of 0.020%), Immigrants from Moldova (6.0%, a difference of 0.050%), Pakistani (6.0%, a difference of 0.060%), and Immigrants from Greece (6.0%, a difference of 0.060%).
| Demographics | Rating | Rank | Ambulatory Disability |
| Immigrants | Philippines | 83.0 /100 | #142 | Excellent 6.0% |
| Romanians | 82.9 /100 | #143 | Excellent 6.0% |
| Macedonians | 82.8 /100 | #144 | Excellent 6.0% |
| Pakistanis | 82.5 /100 | #145 | Excellent 6.0% |
| Immigrants | Greece | 82.5 /100 | #146 | Excellent 6.0% |
| Immigrants | Moldova | 82.4 /100 | #147 | Excellent 6.0% |
| Immigrants | Eastern Europe | 82.0 /100 | #148 | Excellent 6.0% |
| Lithuanians | 81.9 /100 | #149 | Excellent 6.0% |
| Maltese | 81.6 /100 | #150 | Excellent 6.0% |
| Greeks | 79.6 /100 | #151 | Good 6.0% |
| Immigrants | Austria | 78.8 /100 | #152 | Good 6.0% |
| Syrians | 75.5 /100 | #153 | Good 6.0% |
| Immigrants | Croatia | 75.1 /100 | #154 | Good 6.0% |
| Immigrants | Scotland | 72.1 /100 | #155 | Good 6.0% |
| Northern Europeans | 71.8 /100 | #156 | Good 6.0% |
Demographics Similar to Immigrants from Iraq by Ambulatory Disability
In terms of ambulatory disability, the demographic groups most similar to Immigrants from Iraq are Bangladeshi (6.3%, a difference of 0.020%), Immigrants from Laos (6.3%, a difference of 0.080%), Alsatian (6.3%, a difference of 0.11%), Samoan (6.3%, a difference of 0.22%), and Mexican American Indian (6.3%, a difference of 0.23%).
| Demographics | Rating | Rank | Ambulatory Disability |
| Albanians | 19.7 /100 | #202 | Poor 6.2% |
| Immigrants | Ukraine | 18.4 /100 | #203 | Poor 6.2% |
| Immigrants | Congo | 18.2 /100 | #204 | Poor 6.2% |
| Slovenes | 18.0 /100 | #205 | Poor 6.2% |
| Finns | 17.2 /100 | #206 | Poor 6.2% |
| Alsatians | 15.1 /100 | #207 | Poor 6.3% |
| Bangladeshis | 14.2 /100 | #208 | Poor 6.3% |
| Immigrants | Iraq | 14.0 /100 | #209 | Poor 6.3% |
| Immigrants | Laos | 13.2 /100 | #210 | Poor 6.3% |
| Samoans | 12.1 /100 | #211 | Poor 6.3% |
| Mexican American Indians | 12.0 /100 | #212 | Poor 6.3% |
| Japanese | 12.0 /100 | #213 | Poor 6.3% |
| Immigrants | Mexico | 11.0 /100 | #214 | Poor 6.3% |
| Immigrants | Latin America | 11.0 /100 | #215 | Poor 6.3% |
| Canadians | 10.9 /100 | #216 | Poor 6.3% |