Lithuanian vs Mexican Ambulatory Disability
COMPARE
Lithuanian
Mexican
Ambulatory Disability
Ambulatory Disability Comparison
Lithuanians
Mexicans
6.0%
AMBULATORY DISABILITY
81.9/ 100
METRIC RATING
149th/ 347
METRIC RANK
6.4%
AMBULATORY DISABILITY
3.5/ 100
METRIC RATING
230th/ 347
METRIC RANK
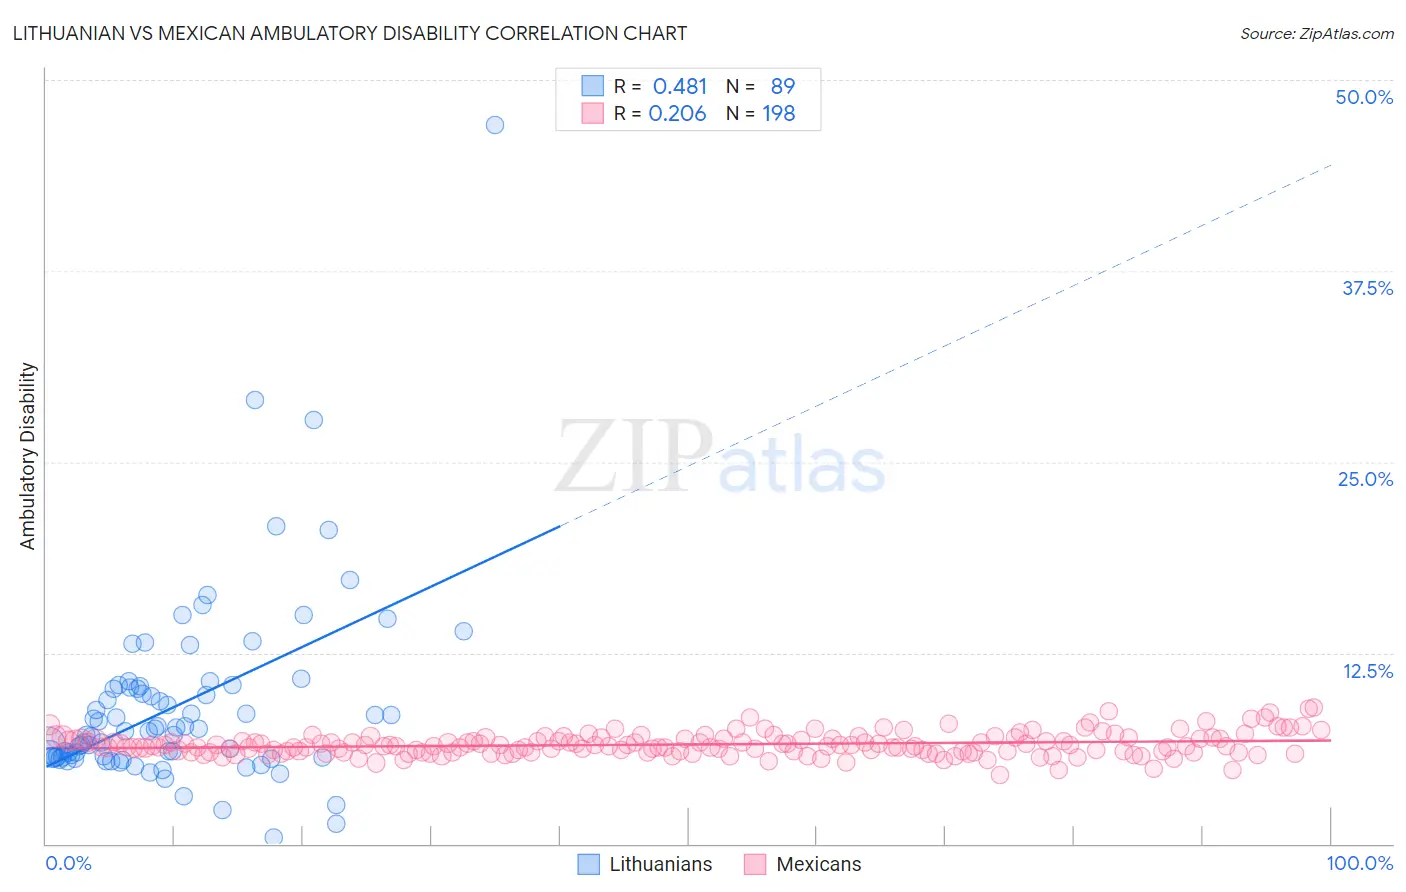
Lithuanian vs Mexican Ambulatory Disability Correlation Chart
The statistical analysis conducted on geographies consisting of 421,829,236 people shows a moderate positive correlation between the proportion of Lithuanians and percentage of population with ambulatory disability in the United States with a correlation coefficient (R) of 0.481 and weighted average of 6.0%. Similarly, the statistical analysis conducted on geographies consisting of 564,662,817 people shows a weak positive correlation between the proportion of Mexicans and percentage of population with ambulatory disability in the United States with a correlation coefficient (R) of 0.206 and weighted average of 6.4%, a difference of 6.5%.
Ambulatory Disability Correlation Summary
| Measurement | Lithuanian | Mexican |
| Minimum | 0.40% | 4.5% |
| Maximum | 47.1% | 8.9% |
| Range | 46.7% | 4.4% |
| Mean | 9.0% | 6.5% |
| Median | 7.4% | 6.4% |
| Interquartile 25% (IQ1) | 5.7% | 6.0% |
| Interquartile 75% (IQ3) | 10.3% | 6.9% |
| Interquartile Range (IQR) | 4.6% | 0.88% |
| Standard Deviation (Sample) | 6.3% | 0.72% |
| Standard Deviation (Population) | 6.3% | 0.72% |
Similar Demographics by Ambulatory Disability
Demographics Similar to Lithuanians by Ambulatory Disability
In terms of ambulatory disability, the demographic groups most similar to Lithuanians are Immigrants from Eastern Europe (6.0%, a difference of 0.010%), Maltese (6.0%, a difference of 0.020%), Immigrants from Moldova (6.0%, a difference of 0.050%), Pakistani (6.0%, a difference of 0.060%), and Immigrants from Greece (6.0%, a difference of 0.060%).
| Demographics | Rating | Rank | Ambulatory Disability |
| Immigrants | Philippines | 83.0 /100 | #142 | Excellent 6.0% |
| Romanians | 82.9 /100 | #143 | Excellent 6.0% |
| Macedonians | 82.8 /100 | #144 | Excellent 6.0% |
| Pakistanis | 82.5 /100 | #145 | Excellent 6.0% |
| Immigrants | Greece | 82.5 /100 | #146 | Excellent 6.0% |
| Immigrants | Moldova | 82.4 /100 | #147 | Excellent 6.0% |
| Immigrants | Eastern Europe | 82.0 /100 | #148 | Excellent 6.0% |
| Lithuanians | 81.9 /100 | #149 | Excellent 6.0% |
| Maltese | 81.6 /100 | #150 | Excellent 6.0% |
| Greeks | 79.6 /100 | #151 | Good 6.0% |
| Immigrants | Austria | 78.8 /100 | #152 | Good 6.0% |
| Syrians | 75.5 /100 | #153 | Good 6.0% |
| Immigrants | Croatia | 75.1 /100 | #154 | Good 6.0% |
| Immigrants | Scotland | 72.1 /100 | #155 | Good 6.0% |
| Northern Europeans | 71.8 /100 | #156 | Good 6.0% |
Demographics Similar to Mexicans by Ambulatory Disability
In terms of ambulatory disability, the demographic groups most similar to Mexicans are Czechoslovakian (6.4%, a difference of 0.11%), Portuguese (6.4%, a difference of 0.15%), Panamanian (6.4%, a difference of 0.16%), Cuban (6.4%, a difference of 0.17%), and Slavic (6.4%, a difference of 0.49%).
| Demographics | Rating | Rank | Ambulatory Disability |
| Immigrants | Honduras | 7.6 /100 | #223 | Tragic 6.3% |
| Liberians | 7.1 /100 | #224 | Tragic 6.3% |
| Hondurans | 6.3 /100 | #225 | Tragic 6.3% |
| Slavs | 5.1 /100 | #226 | Tragic 6.4% |
| Cubans | 4.0 /100 | #227 | Tragic 6.4% |
| Portuguese | 4.0 /100 | #228 | Tragic 6.4% |
| Czechoslovakians | 3.8 /100 | #229 | Tragic 6.4% |
| Mexicans | 3.5 /100 | #230 | Tragic 6.4% |
| Panamanians | 3.1 /100 | #231 | Tragic 6.4% |
| Assyrians/Chaldeans/Syriacs | 2.4 /100 | #232 | Tragic 6.4% |
| Sub-Saharan Africans | 2.3 /100 | #233 | Tragic 6.4% |
| Immigrants | Liberia | 2.3 /100 | #234 | Tragic 6.4% |
| Hispanics or Latinos | 2.2 /100 | #235 | Tragic 6.4% |
| Dutch | 2.0 /100 | #236 | Tragic 6.4% |
| Immigrants | Germany | 1.8 /100 | #237 | Tragic 6.4% |