Latvian vs British Single Mother Households
COMPARE
Latvian
British
Single Mother Households
Single Mother Households Comparison
Latvians
British
5.3%
SINGLE MOTHER HOUSEHOLDS
99.7/ 100
METRIC RATING
29th/ 347
METRIC RANK
5.8%
SINGLE MOTHER HOUSEHOLDS
95.5/ 100
METRIC RATING
110th/ 347
METRIC RANK
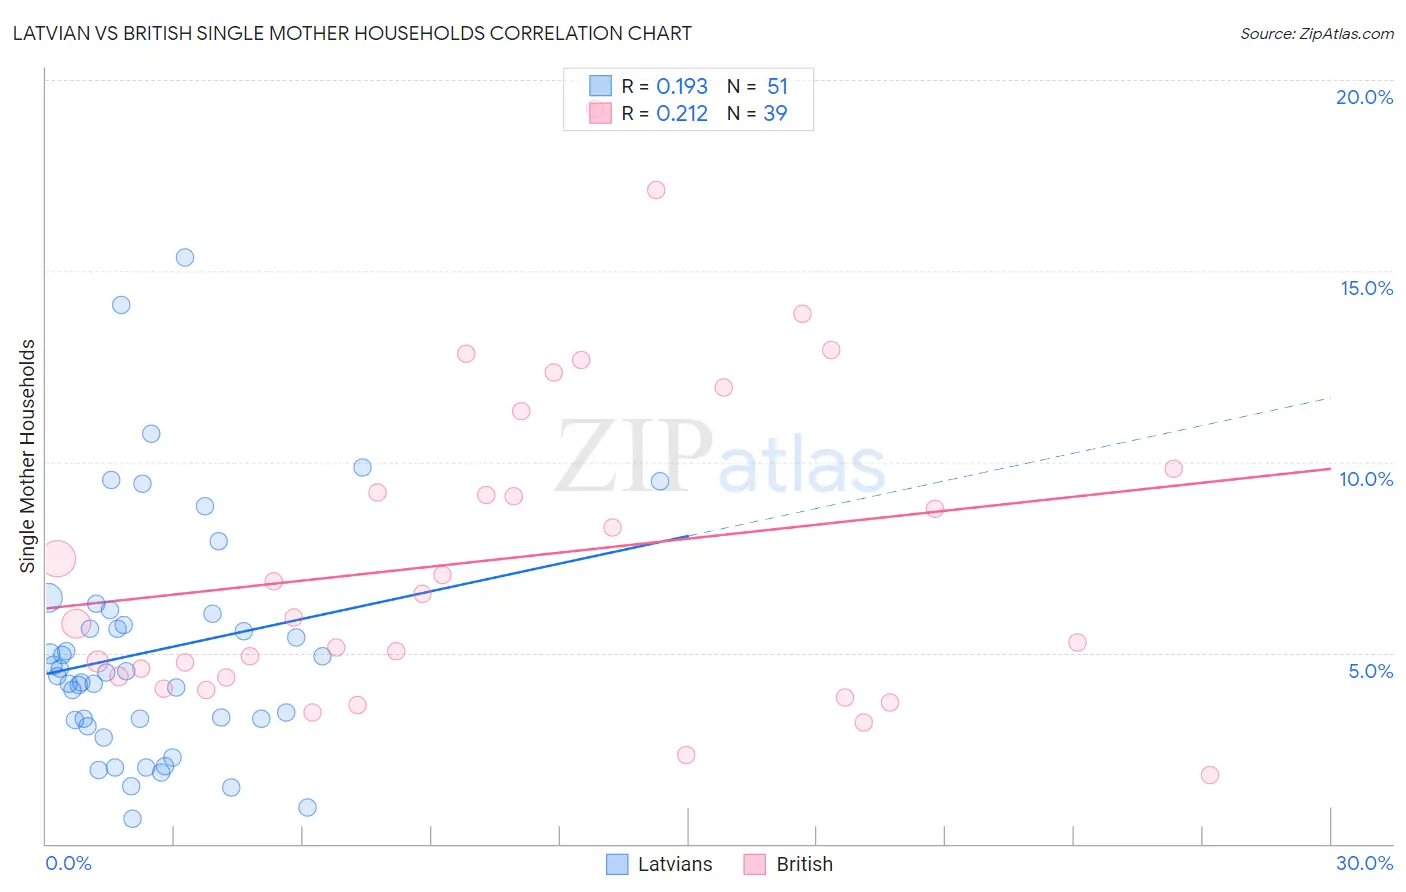
Latvian vs British Single Mother Households Correlation Chart
The statistical analysis conducted on geographies consisting of 220,091,303 people shows a poor positive correlation between the proportion of Latvians and percentage of single mother households in the United States with a correlation coefficient (R) of 0.193 and weighted average of 5.3%. Similarly, the statistical analysis conducted on geographies consisting of 528,132,597 people shows a weak positive correlation between the proportion of British and percentage of single mother households in the United States with a correlation coefficient (R) of 0.212 and weighted average of 5.8%, a difference of 9.4%.
Single Mother Households Correlation Summary
| Measurement | Latvian | British |
| Minimum | 0.66% | 1.8% |
| Maximum | 15.3% | 19.3% |
| Range | 14.7% | 17.5% |
| Mean | 5.1% | 7.5% |
| Median | 4.5% | 5.9% |
| Interquartile 25% (IQ1) | 3.3% | 4.3% |
| Interquartile 75% (IQ3) | 6.0% | 9.8% |
| Interquartile Range (IQR) | 2.8% | 5.5% |
| Standard Deviation (Sample) | 3.1% | 4.2% |
| Standard Deviation (Population) | 3.1% | 4.1% |
Similar Demographics by Single Mother Households
Demographics Similar to Latvians by Single Mother Households
In terms of single mother households, the demographic groups most similar to Latvians are Russian (5.3%, a difference of 0.010%), Burmese (5.3%, a difference of 0.060%), Immigrants from Korea (5.3%, a difference of 0.070%), Cambodian (5.3%, a difference of 0.070%), and Bhutanese (5.3%, a difference of 0.12%).
| Demographics | Rating | Rank | Single Mother Households |
| Thais | 99.8 /100 | #22 | Exceptional 5.2% |
| Immigrants | Austria | 99.8 /100 | #23 | Exceptional 5.2% |
| Armenians | 99.8 /100 | #24 | Exceptional 5.2% |
| Immigrants | Japan | 99.8 /100 | #25 | Exceptional 5.2% |
| Immigrants | Lithuania | 99.8 /100 | #26 | Exceptional 5.3% |
| Bhutanese | 99.7 /100 | #27 | Exceptional 5.3% |
| Russians | 99.7 /100 | #28 | Exceptional 5.3% |
| Latvians | 99.7 /100 | #29 | Exceptional 5.3% |
| Burmese | 99.7 /100 | #30 | Exceptional 5.3% |
| Immigrants | Korea | 99.7 /100 | #31 | Exceptional 5.3% |
| Cambodians | 99.7 /100 | #32 | Exceptional 5.3% |
| Immigrants | Switzerland | 99.7 /100 | #33 | Exceptional 5.3% |
| Bulgarians | 99.7 /100 | #34 | Exceptional 5.3% |
| Immigrants | Northern Europe | 99.7 /100 | #35 | Exceptional 5.3% |
| Immigrants | Czechoslovakia | 99.7 /100 | #36 | Exceptional 5.3% |
Demographics Similar to British by Single Mother Households
In terms of single mother households, the demographic groups most similar to British are Immigrants from England (5.8%, a difference of 0.030%), Immigrants from Kuwait (5.8%, a difference of 0.070%), Immigrants from Western Europe (5.8%, a difference of 0.090%), Mongolian (5.8%, a difference of 0.14%), and Immigrants from Italy (5.8%, a difference of 0.18%).
| Demographics | Rating | Rank | Single Mother Households |
| Scottish | 96.2 /100 | #103 | Exceptional 5.8% |
| Northern Europeans | 96.2 /100 | #104 | Exceptional 5.8% |
| Taiwanese | 96.1 /100 | #105 | Exceptional 5.8% |
| Immigrants | Ukraine | 95.9 /100 | #106 | Exceptional 5.8% |
| Paraguayans | 95.8 /100 | #107 | Exceptional 5.8% |
| Immigrants | Italy | 95.8 /100 | #108 | Exceptional 5.8% |
| Immigrants | Western Europe | 95.7 /100 | #109 | Exceptional 5.8% |
| British | 95.5 /100 | #110 | Exceptional 5.8% |
| Immigrants | England | 95.5 /100 | #111 | Exceptional 5.8% |
| Immigrants | Kuwait | 95.4 /100 | #112 | Exceptional 5.8% |
| Mongolians | 95.3 /100 | #113 | Exceptional 5.8% |
| Dutch | 95.1 /100 | #114 | Exceptional 5.8% |
| Irish | 94.8 /100 | #115 | Exceptional 5.8% |
| Pennsylvania Germans | 94.7 /100 | #116 | Exceptional 5.8% |
| Bolivians | 94.6 /100 | #117 | Exceptional 5.8% |