Immigrants from North America vs Ugandan Disability
COMPARE
Immigrants from North America
Ugandan
Disability
Disability Comparison
Immigrants from North America
Ugandans
12.1%
DISABILITY
5.3/ 100
METRIC RATING
217th/ 347
METRIC RANK
11.4%
DISABILITY
87.9/ 100
METRIC RATING
135th/ 347
METRIC RANK
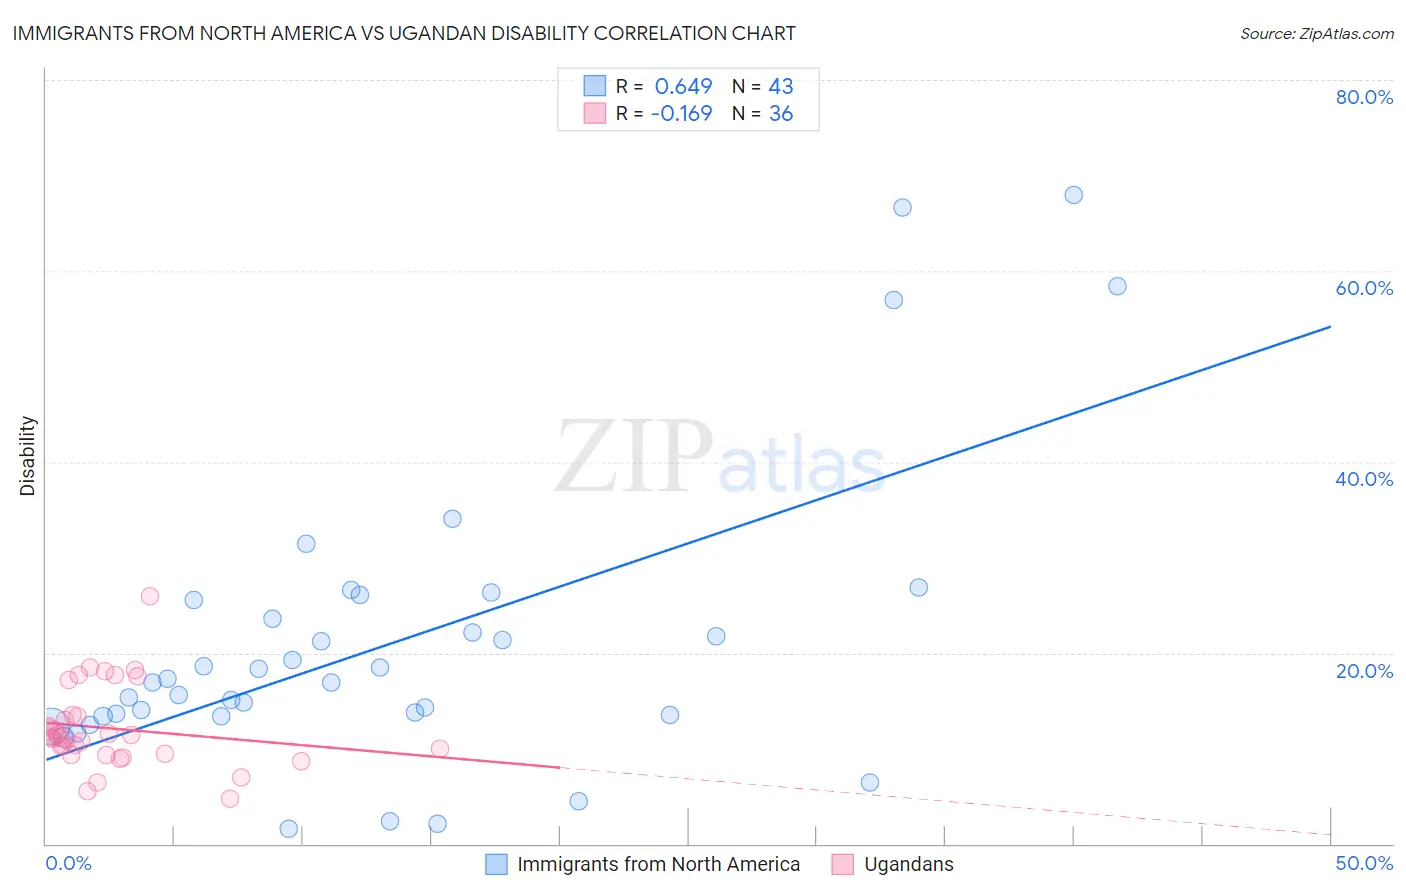
Immigrants from North America vs Ugandan Disability Correlation Chart
The statistical analysis conducted on geographies consisting of 462,438,985 people shows a significant positive correlation between the proportion of Immigrants from North America and percentage of population with a disability in the United States with a correlation coefficient (R) of 0.649 and weighted average of 12.1%. Similarly, the statistical analysis conducted on geographies consisting of 94,018,396 people shows a poor negative correlation between the proportion of Ugandans and percentage of population with a disability in the United States with a correlation coefficient (R) of -0.169 and weighted average of 11.4%, a difference of 5.5%.
Disability Correlation Summary
| Measurement | Immigrants from North America | Ugandan |
| Minimum | 1.6% | 4.7% |
| Maximum | 68.0% | 25.9% |
| Range | 66.4% | 21.2% |
| Mean | 21.0% | 12.1% |
| Median | 16.9% | 11.1% |
| Interquartile 25% (IQ1) | 13.3% | 9.4% |
| Interquartile 75% (IQ3) | 25.6% | 13.4% |
| Interquartile Range (IQR) | 12.2% | 4.1% |
| Standard Deviation (Sample) | 15.3% | 4.3% |
| Standard Deviation (Population) | 15.2% | 4.3% |
Similar Demographics by Disability
Demographics Similar to Immigrants from North America by Disability
In terms of disability, the demographic groups most similar to Immigrants from North America are Panamanian (12.1%, a difference of 0.010%), Immigrants from Jamaica (12.1%, a difference of 0.060%), Croatian (12.1%, a difference of 0.11%), Immigrants from Bahamas (12.1%, a difference of 0.15%), and Immigrants from Canada (12.1%, a difference of 0.16%).
| Demographics | Rating | Rank | Disability |
| Czechs | 7.9 /100 | #210 | Tragic 12.0% |
| Immigrants | Cambodia | 7.3 /100 | #211 | Tragic 12.0% |
| Austrians | 7.2 /100 | #212 | Tragic 12.0% |
| Immigrants | Iraq | 7.1 /100 | #213 | Tragic 12.0% |
| Immigrants | Somalia | 6.8 /100 | #214 | Tragic 12.0% |
| Immigrants | Canada | 6.1 /100 | #215 | Tragic 12.1% |
| Panamanians | 5.4 /100 | #216 | Tragic 12.1% |
| Immigrants | North America | 5.3 /100 | #217 | Tragic 12.1% |
| Immigrants | Jamaica | 5.0 /100 | #218 | Tragic 12.1% |
| Croatians | 4.9 /100 | #219 | Tragic 12.1% |
| Immigrants | Bahamas | 4.7 /100 | #220 | Tragic 12.1% |
| Northern Europeans | 4.2 /100 | #221 | Tragic 12.1% |
| Spanish American Indians | 4.1 /100 | #222 | Tragic 12.1% |
| Hispanics or Latinos | 3.9 /100 | #223 | Tragic 12.1% |
| Mexicans | 3.7 /100 | #224 | Tragic 12.1% |
Demographics Similar to Ugandans by Disability
In terms of disability, the demographic groups most similar to Ugandans are Immigrants from St. Vincent and the Grenadines (11.4%, a difference of 0.010%), Immigrants from Guyana (11.4%, a difference of 0.050%), Kenyan (11.5%, a difference of 0.080%), New Zealander (11.5%, a difference of 0.090%), and Ghanaian (11.5%, a difference of 0.10%).
| Demographics | Rating | Rank | Disability |
| Immigrants | Europe | 90.4 /100 | #128 | Exceptional 11.4% |
| Macedonians | 90.3 /100 | #129 | Exceptional 11.4% |
| Latvians | 89.8 /100 | #130 | Excellent 11.4% |
| Immigrants | Croatia | 89.8 /100 | #131 | Excellent 11.4% |
| Immigrants | Africa | 89.3 /100 | #132 | Excellent 11.4% |
| Arabs | 89.1 /100 | #133 | Excellent 11.4% |
| Immigrants | Guyana | 88.3 /100 | #134 | Excellent 11.4% |
| Ugandans | 87.9 /100 | #135 | Excellent 11.4% |
| Immigrants | St. Vincent and the Grenadines | 87.8 /100 | #136 | Excellent 11.4% |
| Kenyans | 87.1 /100 | #137 | Excellent 11.5% |
| New Zealanders | 87.0 /100 | #138 | Excellent 11.5% |
| Ghanaians | 87.0 /100 | #139 | Excellent 11.5% |
| Russians | 86.8 /100 | #140 | Excellent 11.5% |
| Immigrants | Grenada | 86.1 /100 | #141 | Excellent 11.5% |
| Immigrants | Sudan | 85.3 /100 | #142 | Excellent 11.5% |