Korean vs Costa Rican Hearing Disability
COMPARE
Korean
Costa Rican
Hearing Disability
Hearing Disability Comparison
Koreans
Costa Ricans
3.1%
HEARING DISABILITY
27.6/ 100
METRIC RATING
192nd/ 347
METRIC RANK
2.9%
HEARING DISABILITY
71.4/ 100
METRIC RATING
155th/ 347
METRIC RANK
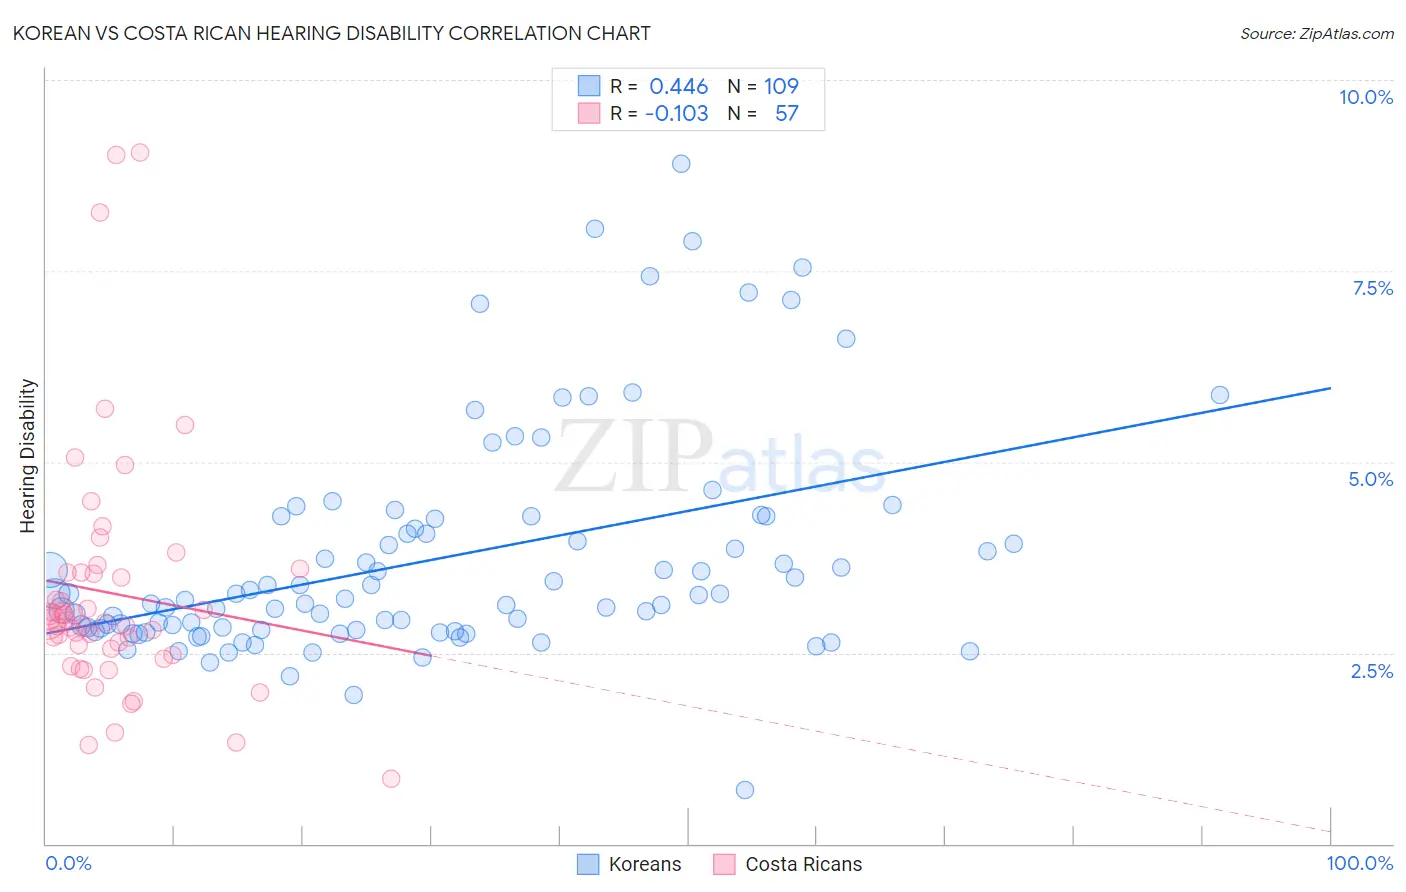
Korean vs Costa Rican Hearing Disability Correlation Chart
The statistical analysis conducted on geographies consisting of 510,543,353 people shows a moderate positive correlation between the proportion of Koreans and percentage of population with hearing disability in the United States with a correlation coefficient (R) of 0.446 and weighted average of 3.1%. Similarly, the statistical analysis conducted on geographies consisting of 253,538,538 people shows a poor negative correlation between the proportion of Costa Ricans and percentage of population with hearing disability in the United States with a correlation coefficient (R) of -0.103 and weighted average of 2.9%, a difference of 4.5%.
Hearing Disability Correlation Summary
| Measurement | Korean | Costa Rican |
| Minimum | 0.70% | 0.86% |
| Maximum | 8.9% | 9.0% |
| Range | 8.2% | 8.2% |
| Mean | 3.7% | 3.3% |
| Median | 3.2% | 2.9% |
| Interquartile 25% (IQ1) | 2.8% | 2.5% |
| Interquartile 75% (IQ3) | 4.2% | 3.6% |
| Interquartile Range (IQR) | 1.4% | 1.0% |
| Standard Deviation (Sample) | 1.5% | 1.6% |
| Standard Deviation (Population) | 1.5% | 1.6% |
Similar Demographics by Hearing Disability
Demographics Similar to Koreans by Hearing Disability
In terms of hearing disability, the demographic groups most similar to Koreans are Macedonian (3.1%, a difference of 0.080%), Immigrants from Switzerland (3.1%, a difference of 0.13%), South African (3.1%, a difference of 0.37%), Immigrants from South Africa (3.1%, a difference of 0.38%), and Spanish American Indian (3.1%, a difference of 0.42%).
| Demographics | Rating | Rank | Hearing Disability |
| Immigrants | Southern Europe | 35.3 /100 | #185 | Fair 3.0% |
| Immigrants | Mexico | 34.9 /100 | #186 | Fair 3.0% |
| Blacks/African Americans | 34.7 /100 | #187 | Fair 3.0% |
| Mexican American Indians | 34.7 /100 | #188 | Fair 3.0% |
| Africans | 32.9 /100 | #189 | Fair 3.0% |
| Immigrants | South Africa | 31.1 /100 | #190 | Fair 3.1% |
| Immigrants | Switzerland | 28.8 /100 | #191 | Fair 3.1% |
| Koreans | 27.6 /100 | #192 | Fair 3.1% |
| Macedonians | 27.0 /100 | #193 | Fair 3.1% |
| South Africans | 24.5 /100 | #194 | Fair 3.1% |
| Spanish American Indians | 24.1 /100 | #195 | Fair 3.1% |
| Immigrants | Europe | 22.9 /100 | #196 | Fair 3.1% |
| Immigrants | Bosnia and Herzegovina | 20.6 /100 | #197 | Fair 3.1% |
| Immigrants | Croatia | 20.5 /100 | #198 | Fair 3.1% |
| Syrians | 19.2 /100 | #199 | Poor 3.1% |
Demographics Similar to Costa Ricans by Hearing Disability
In terms of hearing disability, the demographic groups most similar to Costa Ricans are Immigrants from Lebanon (2.9%, a difference of 0.010%), Sudanese (2.9%, a difference of 0.090%), Immigrants from Poland (2.9%, a difference of 0.14%), Immigrants from Lithuania (2.9%, a difference of 0.19%), and Immigrants from France (2.9%, a difference of 0.21%).
| Demographics | Rating | Rank | Hearing Disability |
| Immigrants | Russia | 77.7 /100 | #148 | Good 2.9% |
| Immigrants | Panama | 76.9 /100 | #149 | Good 2.9% |
| Palestinians | 73.6 /100 | #150 | Good 2.9% |
| Immigrants | France | 73.1 /100 | #151 | Good 2.9% |
| Immigrants | Lithuania | 73.0 /100 | #152 | Good 2.9% |
| Sudanese | 72.1 /100 | #153 | Good 2.9% |
| Immigrants | Lebanon | 71.5 /100 | #154 | Good 2.9% |
| Costa Ricans | 71.4 /100 | #155 | Good 2.9% |
| Immigrants | Poland | 70.2 /100 | #156 | Good 2.9% |
| Immigrants | Kazakhstan | 69.6 /100 | #157 | Good 2.9% |
| Immigrants | Burma/Myanmar | 69.5 /100 | #158 | Good 2.9% |
| Immigrants | Australia | 67.4 /100 | #159 | Good 2.9% |
| Immigrants | Fiji | 67.1 /100 | #160 | Good 2.9% |
| Albanians | 66.6 /100 | #161 | Good 2.9% |
| Immigrants | Japan | 66.3 /100 | #162 | Good 2.9% |