Korean vs Immigrants from Belarus Vision Disability
COMPARE
Korean
Immigrants from Belarus
Vision Disability
Vision Disability Comparison
Koreans
Immigrants from Belarus
2.1%
VISION DISABILITY
94.1/ 100
METRIC RATING
108th/ 347
METRIC RANK
2.0%
VISION DISABILITY
99.3/ 100
METRIC RATING
53rd/ 347
METRIC RANK
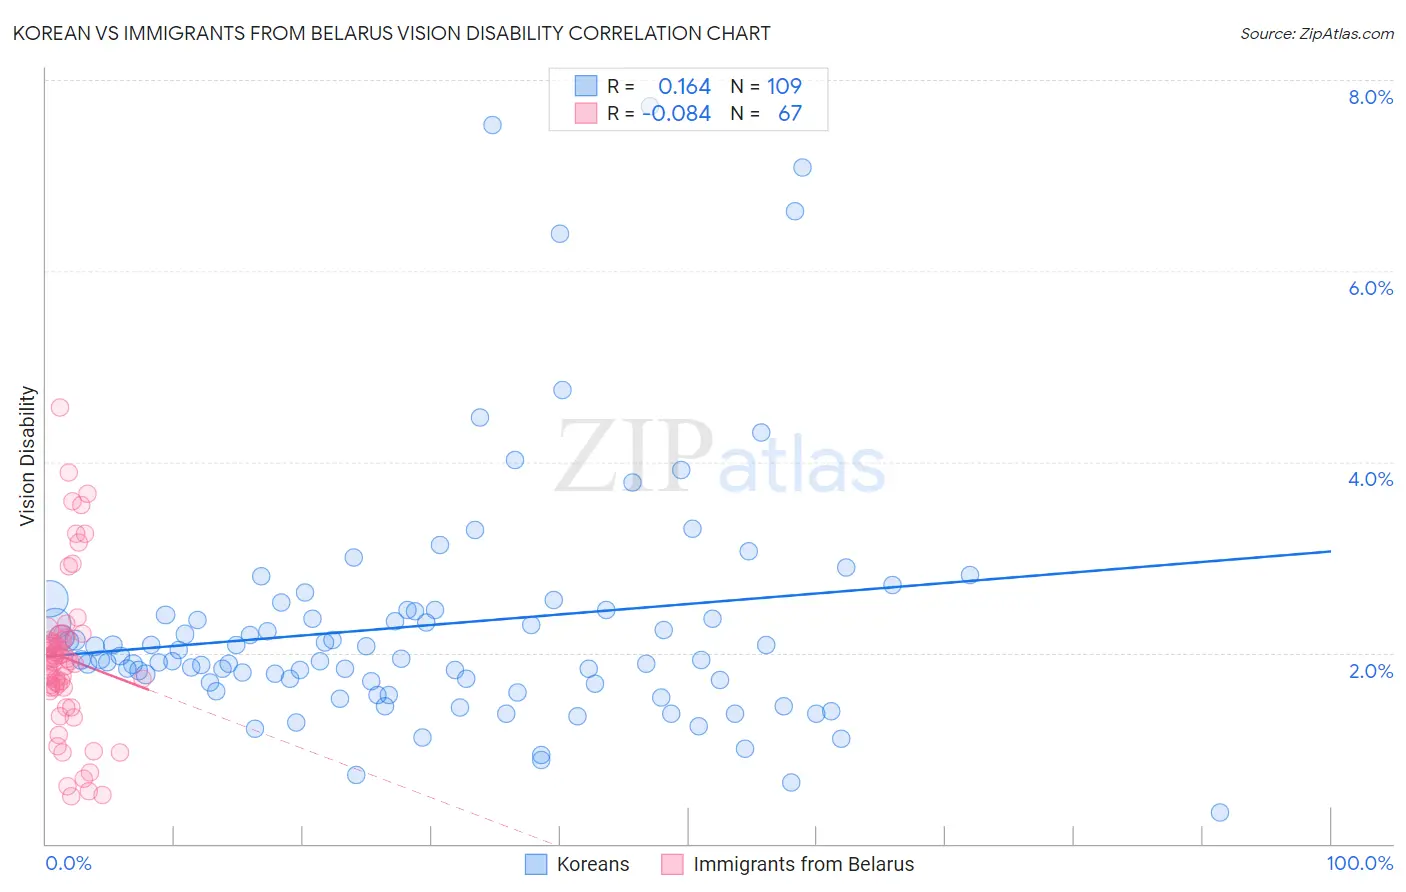
Korean vs Immigrants from Belarus Vision Disability Correlation Chart
The statistical analysis conducted on geographies consisting of 510,182,066 people shows a poor positive correlation between the proportion of Koreans and percentage of population with vision disability in the United States with a correlation coefficient (R) of 0.164 and weighted average of 2.1%. Similarly, the statistical analysis conducted on geographies consisting of 150,159,443 people shows a slight negative correlation between the proportion of Immigrants from Belarus and percentage of population with vision disability in the United States with a correlation coefficient (R) of -0.084 and weighted average of 2.0%, a difference of 3.9%.
Vision Disability Correlation Summary
| Measurement | Korean | Immigrants from Belarus |
| Minimum | 0.33% | 0.50% |
| Maximum | 7.7% | 4.6% |
| Range | 7.4% | 4.1% |
| Mean | 2.3% | 1.9% |
| Median | 1.9% | 1.9% |
| Interquartile 25% (IQ1) | 1.7% | 1.6% |
| Interquartile 75% (IQ3) | 2.4% | 2.2% |
| Interquartile Range (IQR) | 0.76% | 0.52% |
| Standard Deviation (Sample) | 1.3% | 0.82% |
| Standard Deviation (Population) | 1.3% | 0.81% |
Similar Demographics by Vision Disability
Demographics Similar to Koreans by Vision Disability
In terms of vision disability, the demographic groups most similar to Koreans are Chilean (2.1%, a difference of 0.020%), Swedish (2.1%, a difference of 0.030%), Danish (2.1%, a difference of 0.030%), Carpatho Rusyn (2.1%, a difference of 0.080%), and Immigrants from Italy (2.1%, a difference of 0.090%).
| Demographics | Rating | Rank | Vision Disability |
| Albanians | 94.9 /100 | #101 | Exceptional 2.1% |
| Sri Lankans | 94.8 /100 | #102 | Exceptional 2.1% |
| Immigrants | Austria | 94.4 /100 | #103 | Exceptional 2.1% |
| Immigrants | Italy | 94.4 /100 | #104 | Exceptional 2.1% |
| Carpatho Rusyns | 94.3 /100 | #105 | Exceptional 2.1% |
| Swedes | 94.2 /100 | #106 | Exceptional 2.1% |
| Danes | 94.2 /100 | #107 | Exceptional 2.1% |
| Koreans | 94.1 /100 | #108 | Exceptional 2.1% |
| Chileans | 94.0 /100 | #109 | Exceptional 2.1% |
| Immigrants | Armenia | 93.8 /100 | #110 | Exceptional 2.1% |
| Peruvians | 93.5 /100 | #111 | Exceptional 2.1% |
| Immigrants | Denmark | 92.9 /100 | #112 | Exceptional 2.1% |
| Kenyans | 92.5 /100 | #113 | Exceptional 2.1% |
| Croatians | 92.3 /100 | #114 | Exceptional 2.1% |
| Immigrants | Vietnam | 92.2 /100 | #115 | Exceptional 2.1% |
Demographics Similar to Immigrants from Belarus by Vision Disability
In terms of vision disability, the demographic groups most similar to Immigrants from Belarus are Macedonian (2.0%, a difference of 0.040%), Laotian (2.0%, a difference of 0.090%), Immigrants from Serbia (2.0%, a difference of 0.11%), Jordanian (2.0%, a difference of 0.26%), and Somali (2.0%, a difference of 0.28%).
| Demographics | Rating | Rank | Vision Disability |
| Immigrants | Sweden | 99.7 /100 | #46 | Exceptional 2.0% |
| Immigrants | Bulgaria | 99.7 /100 | #47 | Exceptional 2.0% |
| Israelis | 99.6 /100 | #48 | Exceptional 2.0% |
| Latvians | 99.5 /100 | #49 | Exceptional 2.0% |
| Afghans | 99.5 /100 | #50 | Exceptional 2.0% |
| Tongans | 99.5 /100 | #51 | Exceptional 2.0% |
| Immigrants | Serbia | 99.4 /100 | #52 | Exceptional 2.0% |
| Immigrants | Belarus | 99.3 /100 | #53 | Exceptional 2.0% |
| Macedonians | 99.3 /100 | #54 | Exceptional 2.0% |
| Laotians | 99.3 /100 | #55 | Exceptional 2.0% |
| Jordanians | 99.2 /100 | #56 | Exceptional 2.0% |
| Somalis | 99.2 /100 | #57 | Exceptional 2.0% |
| Immigrants | Saudi Arabia | 99.2 /100 | #58 | Exceptional 2.0% |
| Argentineans | 99.1 /100 | #59 | Exceptional 2.0% |
| Immigrants | Romania | 99.1 /100 | #60 | Exceptional 2.0% |