Korean vs Soviet Union Unemployment
COMPARE
Korean
Soviet Union
Unemployment
Unemployment Comparison
Koreans
Soviet Union
5.3%
UNEMPLOYMENT
27.4/ 100
METRIC RATING
200th/ 347
METRIC RANK
5.4%
UNEMPLOYMENT
10.6/ 100
METRIC RATING
220th/ 347
METRIC RANK
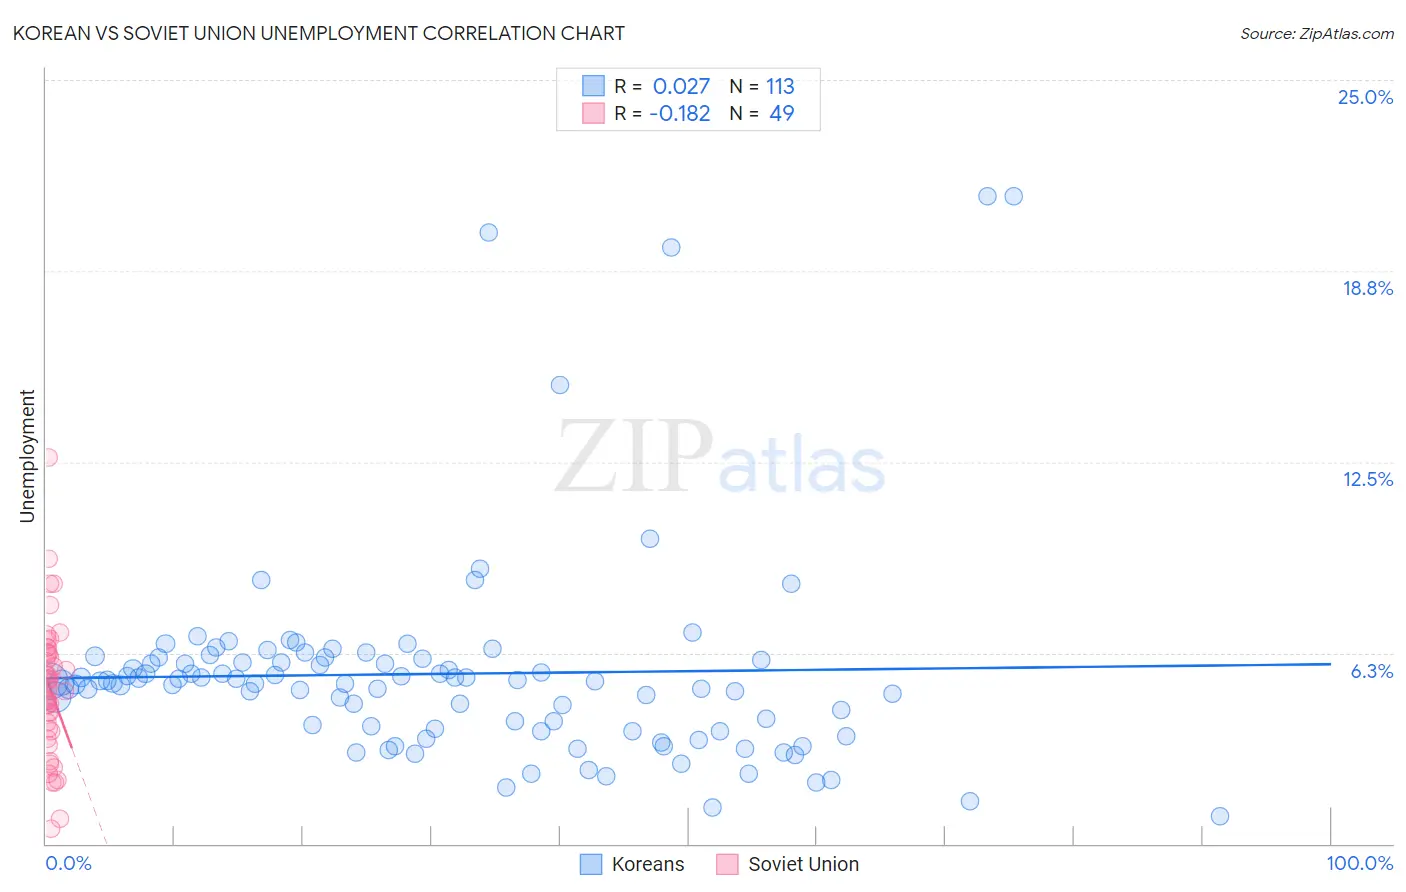
Korean vs Soviet Union Unemployment Correlation Chart
The statistical analysis conducted on geographies consisting of 509,828,935 people shows no correlation between the proportion of Koreans and unemployment in the United States with a correlation coefficient (R) of 0.027 and weighted average of 5.3%. Similarly, the statistical analysis conducted on geographies consisting of 43,502,228 people shows a poor negative correlation between the proportion of Soviet Union and unemployment in the United States with a correlation coefficient (R) of -0.182 and weighted average of 5.4%, a difference of 1.7%.
Unemployment Correlation Summary
| Measurement | Korean | Soviet Union |
| Minimum | 0.90% | 0.50% |
| Maximum | 21.2% | 12.6% |
| Range | 20.3% | 12.1% |
| Mean | 5.6% | 5.1% |
| Median | 5.3% | 5.2% |
| Interquartile 25% (IQ1) | 3.7% | 3.7% |
| Interquartile 75% (IQ3) | 6.0% | 6.2% |
| Interquartile Range (IQR) | 2.3% | 2.5% |
| Standard Deviation (Sample) | 3.4% | 2.2% |
| Standard Deviation (Population) | 3.4% | 2.2% |
Demographics Similar to Koreans and Soviet Union by Unemployment
In terms of unemployment, the demographic groups most similar to Koreans are Immigrants from South Eastern Asia (5.3%, a difference of 0.030%), Cherokee (5.3%, a difference of 0.14%), Immigrants from Micronesia (5.3%, a difference of 0.17%), Immigrants from Ukraine (5.3%, a difference of 0.20%), and Native Hawaiian (5.3%, a difference of 0.25%). Similarly, the demographic groups most similar to Soviet Union are Bangladeshi (5.4%, a difference of 0.080%), Choctaw (5.4%, a difference of 0.30%), Immigrants from South America (5.4%, a difference of 0.40%), Immigrants from Albania (5.4%, a difference of 0.40%), and Delaware (5.4%, a difference of 0.56%).
| Demographics | Rating | Rank | Unemployment |
| Koreans | 27.4 /100 | #200 | Fair 5.3% |
| Immigrants | South Eastern Asia | 27.0 /100 | #201 | Fair 5.3% |
| Cherokee | 25.5 /100 | #202 | Fair 5.3% |
| Immigrants | Micronesia | 25.2 /100 | #203 | Fair 5.3% |
| Immigrants | Ukraine | 24.9 /100 | #204 | Fair 5.3% |
| Native Hawaiians | 24.1 /100 | #205 | Fair 5.3% |
| Immigrants | Peru | 22.7 /100 | #206 | Fair 5.4% |
| Creek | 19.4 /100 | #207 | Poor 5.4% |
| Portuguese | 19.0 /100 | #208 | Poor 5.4% |
| Immigrants | Iran | 18.8 /100 | #209 | Poor 5.4% |
| Immigrants | Iraq | 18.6 /100 | #210 | Poor 5.4% |
| Iraqis | 18.1 /100 | #211 | Poor 5.4% |
| Ugandans | 18.0 /100 | #212 | Poor 5.4% |
| Immigrants | Middle Africa | 15.3 /100 | #213 | Poor 5.4% |
| Immigrants | Costa Rica | 15.2 /100 | #214 | Poor 5.4% |
| Delaware | 14.7 /100 | #215 | Poor 5.4% |
| Immigrants | South America | 13.5 /100 | #216 | Poor 5.4% |
| Immigrants | Albania | 13.5 /100 | #217 | Poor 5.4% |
| Choctaw | 12.7 /100 | #218 | Poor 5.4% |
| Bangladeshis | 11.2 /100 | #219 | Poor 5.4% |
| Soviet Union | 10.6 /100 | #220 | Poor 5.4% |