Korean vs Black/African American Vision Disability
COMPARE
Korean
Black/African American
Vision Disability
Vision Disability Comparison
Koreans
Blacks/African Americans
2.1%
VISION DISABILITY
94.1/ 100
METRIC RATING
108th/ 347
METRIC RANK
2.8%
VISION DISABILITY
0.0/ 100
METRIC RATING
320th/ 347
METRIC RANK
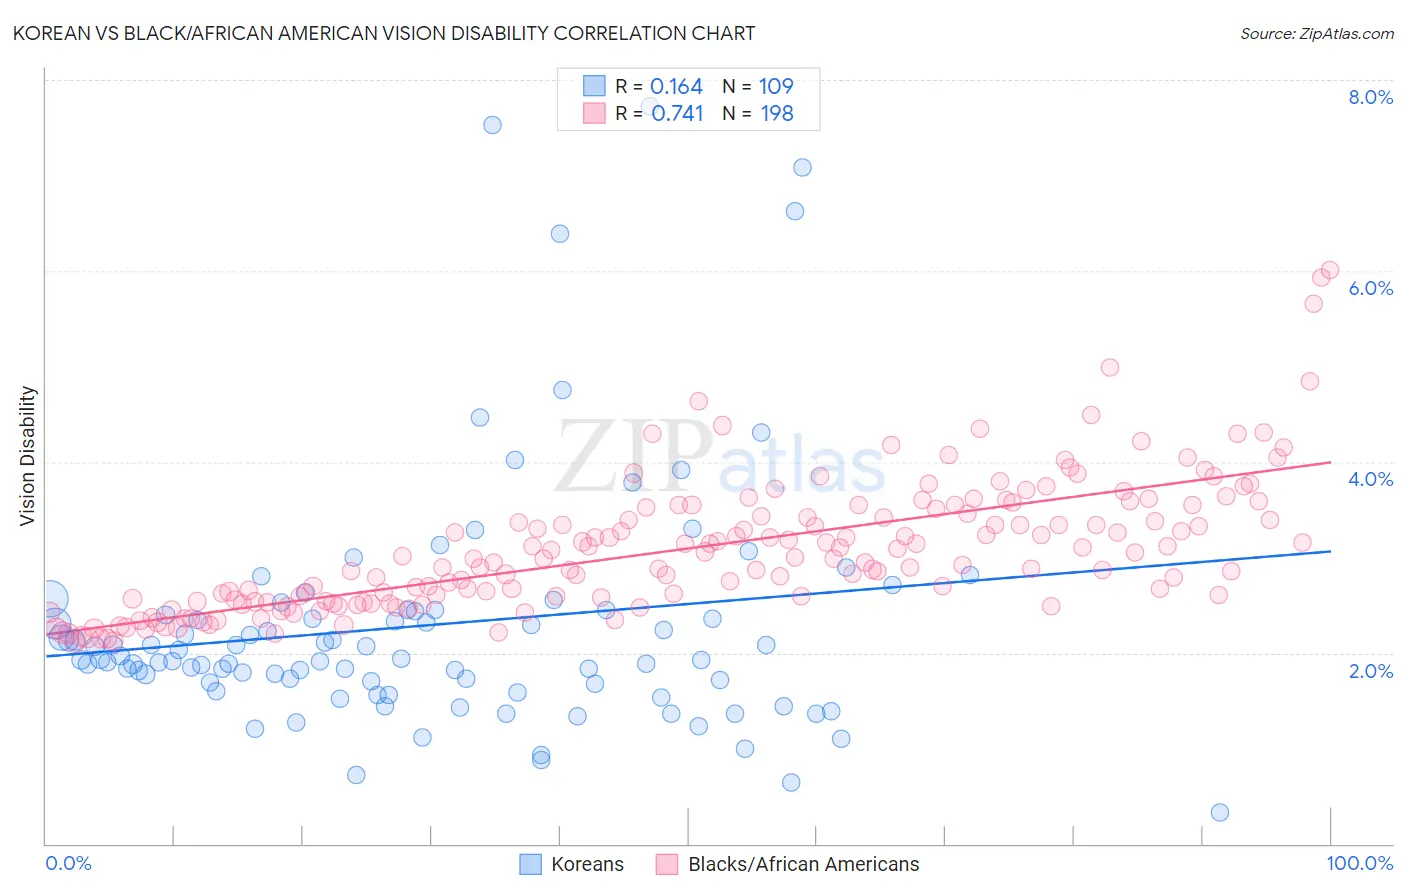
Korean vs Black/African American Vision Disability Correlation Chart
The statistical analysis conducted on geographies consisting of 510,182,066 people shows a poor positive correlation between the proportion of Koreans and percentage of population with vision disability in the United States with a correlation coefficient (R) of 0.164 and weighted average of 2.1%. Similarly, the statistical analysis conducted on geographies consisting of 564,452,359 people shows a strong positive correlation between the proportion of Blacks/African Americans and percentage of population with vision disability in the United States with a correlation coefficient (R) of 0.741 and weighted average of 2.8%, a difference of 34.5%.
Vision Disability Correlation Summary
| Measurement | Korean | Black/African American |
| Minimum | 0.33% | 2.1% |
| Maximum | 7.7% | 6.0% |
| Range | 7.4% | 3.9% |
| Mean | 2.3% | 3.1% |
| Median | 1.9% | 3.0% |
| Interquartile 25% (IQ1) | 1.7% | 2.5% |
| Interquartile 75% (IQ3) | 2.4% | 3.5% |
| Interquartile Range (IQR) | 0.76% | 0.91% |
| Standard Deviation (Sample) | 1.3% | 0.70% |
| Standard Deviation (Population) | 1.3% | 0.70% |
Similar Demographics by Vision Disability
Demographics Similar to Koreans by Vision Disability
In terms of vision disability, the demographic groups most similar to Koreans are Chilean (2.1%, a difference of 0.020%), Swedish (2.1%, a difference of 0.030%), Danish (2.1%, a difference of 0.030%), Carpatho Rusyn (2.1%, a difference of 0.080%), and Immigrants from Italy (2.1%, a difference of 0.090%).
| Demographics | Rating | Rank | Vision Disability |
| Albanians | 94.9 /100 | #101 | Exceptional 2.1% |
| Sri Lankans | 94.8 /100 | #102 | Exceptional 2.1% |
| Immigrants | Austria | 94.4 /100 | #103 | Exceptional 2.1% |
| Immigrants | Italy | 94.4 /100 | #104 | Exceptional 2.1% |
| Carpatho Rusyns | 94.3 /100 | #105 | Exceptional 2.1% |
| Swedes | 94.2 /100 | #106 | Exceptional 2.1% |
| Danes | 94.2 /100 | #107 | Exceptional 2.1% |
| Koreans | 94.1 /100 | #108 | Exceptional 2.1% |
| Chileans | 94.0 /100 | #109 | Exceptional 2.1% |
| Immigrants | Armenia | 93.8 /100 | #110 | Exceptional 2.1% |
| Peruvians | 93.5 /100 | #111 | Exceptional 2.1% |
| Immigrants | Denmark | 92.9 /100 | #112 | Exceptional 2.1% |
| Kenyans | 92.5 /100 | #113 | Exceptional 2.1% |
| Croatians | 92.3 /100 | #114 | Exceptional 2.1% |
| Immigrants | Vietnam | 92.2 /100 | #115 | Exceptional 2.1% |
Demographics Similar to Blacks/African Americans by Vision Disability
In terms of vision disability, the demographic groups most similar to Blacks/African Americans are Tohono O'odham (2.8%, a difference of 0.69%), Comanche (2.8%, a difference of 2.0%), Alaska Native (2.7%, a difference of 2.1%), Paiute (2.9%, a difference of 2.5%), and Tlingit-Haida (2.9%, a difference of 2.5%).
| Demographics | Rating | Rank | Vision Disability |
| Potawatomi | 0.0 /100 | #313 | Tragic 2.6% |
| Inupiat | 0.0 /100 | #314 | Tragic 2.7% |
| Osage | 0.0 /100 | #315 | Tragic 2.7% |
| Shoshone | 0.0 /100 | #316 | Tragic 2.7% |
| Yup'ik | 0.0 /100 | #317 | Tragic 2.7% |
| Alaska Natives | 0.0 /100 | #318 | Tragic 2.7% |
| Tohono O'odham | 0.0 /100 | #319 | Tragic 2.8% |
| Blacks/African Americans | 0.0 /100 | #320 | Tragic 2.8% |
| Comanche | 0.0 /100 | #321 | Tragic 2.8% |
| Paiute | 0.0 /100 | #322 | Tragic 2.9% |
| Tlingit-Haida | 0.0 /100 | #323 | Tragic 2.9% |
| Hopi | 0.0 /100 | #324 | Tragic 2.9% |
| Cherokee | 0.0 /100 | #325 | Tragic 2.9% |
| Spanish Americans | 0.0 /100 | #326 | Tragic 2.9% |
| Natives/Alaskans | 0.0 /100 | #327 | Tragic 3.0% |