Kiowa vs Immigrants from China Disability Age Under 5
COMPARE
Kiowa
Immigrants from China
Disability Age Under 5
Disability Age Under 5 Comparison
Kiowa
Immigrants from China
1.5%
DISABILITY AGE UNDER 5
0.0/ 100
METRIC RATING
278th/ 347
METRIC RANK
0.96%
DISABILITY AGE UNDER 5
100.0/ 100
METRIC RATING
17th/ 347
METRIC RANK
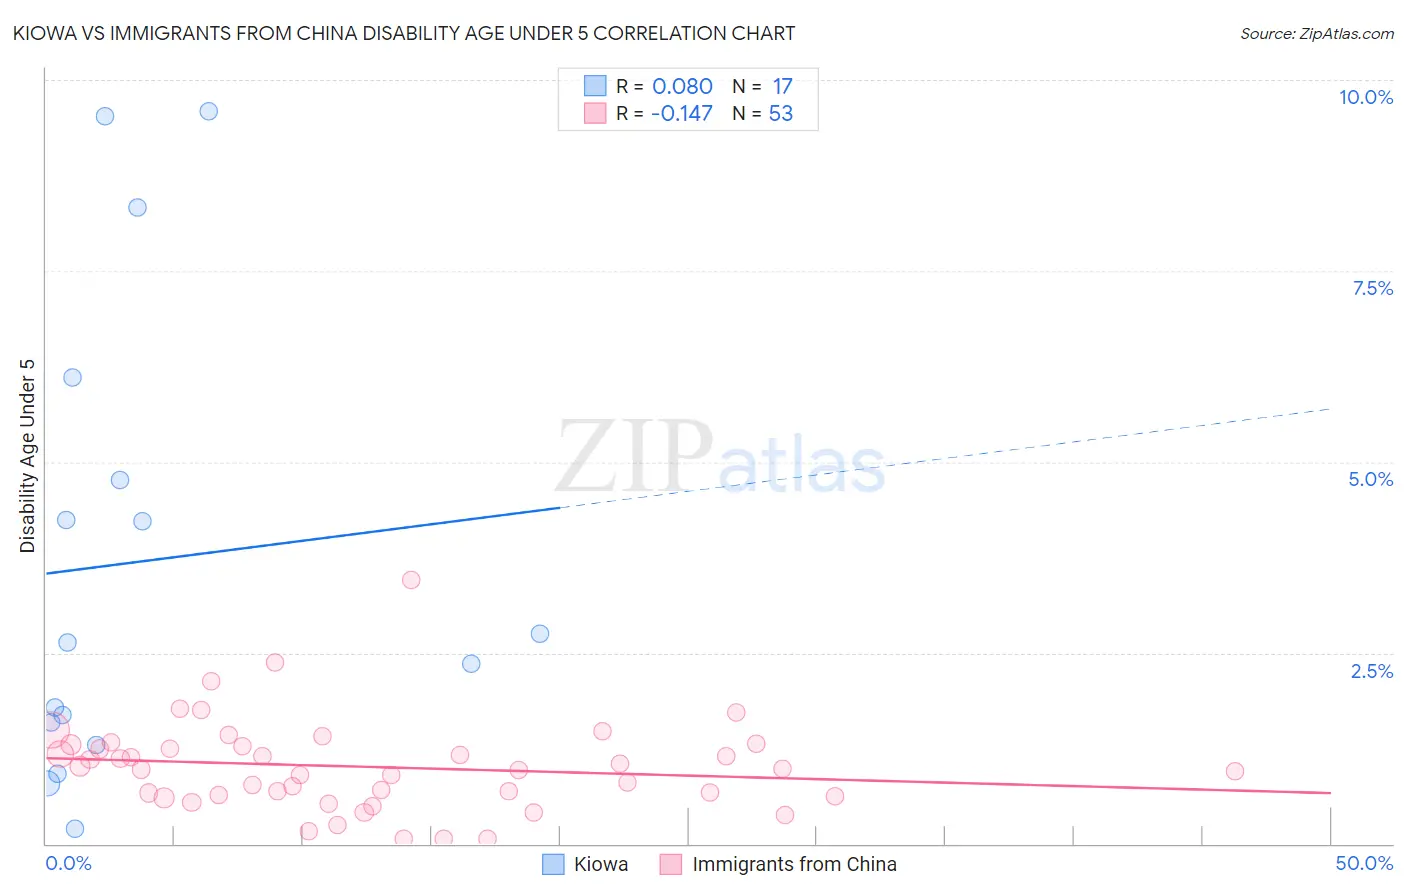
Kiowa vs Immigrants from China Disability Age Under 5 Correlation Chart
The statistical analysis conducted on geographies consisting of 48,964,732 people shows a slight positive correlation between the proportion of Kiowa and percentage of population with a disability under the age of 5 in the United States with a correlation coefficient (R) of 0.080 and weighted average of 1.5%. Similarly, the statistical analysis conducted on geographies consisting of 235,609,500 people shows a poor negative correlation between the proportion of Immigrants from China and percentage of population with a disability under the age of 5 in the United States with a correlation coefficient (R) of -0.147 and weighted average of 0.96%, a difference of 53.3%.
Disability Age Under 5 Correlation Summary
| Measurement | Kiowa | Immigrants from China |
| Minimum | 0.20% | 0.058% |
| Maximum | 9.6% | 3.5% |
| Range | 9.4% | 3.4% |
| Mean | 3.7% | 1.0% |
| Median | 2.6% | 0.97% |
| Interquartile 25% (IQ1) | 1.4% | 0.63% |
| Interquartile 75% (IQ3) | 5.4% | 1.3% |
| Interquartile Range (IQR) | 4.0% | 0.65% |
| Standard Deviation (Sample) | 3.0% | 0.61% |
| Standard Deviation (Population) | 2.9% | 0.60% |
Similar Demographics by Disability Age Under 5
Demographics Similar to Kiowa by Disability Age Under 5
In terms of disability age under 5, the demographic groups most similar to Kiowa are Danish (1.5%, a difference of 0.010%), Canadian (1.5%, a difference of 0.080%), British (1.5%, a difference of 0.77%), Greek (1.5%, a difference of 0.78%), and Brazilian (1.5%, a difference of 1.4%).
| Demographics | Rating | Rank | Disability Age Under 5 |
| Immigrants | Canada | 0.1 /100 | #271 | Tragic 1.4% |
| Blacks/African Americans | 0.1 /100 | #272 | Tragic 1.4% |
| Alaskan Athabascans | 0.1 /100 | #273 | Tragic 1.5% |
| Iroquois | 0.0 /100 | #274 | Tragic 1.5% |
| Brazilians | 0.0 /100 | #275 | Tragic 1.5% |
| Greeks | 0.0 /100 | #276 | Tragic 1.5% |
| Canadians | 0.0 /100 | #277 | Tragic 1.5% |
| Kiowa | 0.0 /100 | #278 | Tragic 1.5% |
| Danes | 0.0 /100 | #279 | Tragic 1.5% |
| British | 0.0 /100 | #280 | Tragic 1.5% |
| Czechoslovakians | 0.0 /100 | #281 | Tragic 1.5% |
| Cheyenne | 0.0 /100 | #282 | Tragic 1.5% |
| Delaware | 0.0 /100 | #283 | Tragic 1.5% |
| Europeans | 0.0 /100 | #284 | Tragic 1.5% |
| Croatians | 0.0 /100 | #285 | Tragic 1.5% |
Demographics Similar to Immigrants from China by Disability Age Under 5
In terms of disability age under 5, the demographic groups most similar to Immigrants from China are Immigrants from Israel (0.96%, a difference of 0.41%), Immigrants from Barbados (0.97%, a difference of 0.58%), Puget Sound Salish (0.97%, a difference of 0.95%), Nepalese (0.97%, a difference of 1.1%), and Immigrants from Hong Kong (0.95%, a difference of 1.7%).
| Demographics | Rating | Rank | Disability Age Under 5 |
| Marshallese | 100.0 /100 | #10 | Exceptional 0.94% |
| Afghans | 100.0 /100 | #11 | Exceptional 0.94% |
| Immigrants | Grenada | 100.0 /100 | #12 | Exceptional 0.94% |
| Soviet Union | 100.0 /100 | #13 | Exceptional 0.95% |
| Yuman | 100.0 /100 | #14 | Exceptional 0.95% |
| Immigrants | Hong Kong | 100.0 /100 | #15 | Exceptional 0.95% |
| Immigrants | Israel | 100.0 /100 | #16 | Exceptional 0.96% |
| Immigrants | China | 100.0 /100 | #17 | Exceptional 0.96% |
| Immigrants | Barbados | 100.0 /100 | #18 | Exceptional 0.97% |
| Puget Sound Salish | 100.0 /100 | #19 | Exceptional 0.97% |
| Nepalese | 100.0 /100 | #20 | Exceptional 0.97% |
| British West Indians | 100.0 /100 | #21 | Exceptional 0.99% |
| Immigrants | Iran | 100.0 /100 | #22 | Exceptional 1.00% |
| Yakama | 100.0 /100 | #23 | Exceptional 1.00% |
| Indians (Asian) | 100.0 /100 | #24 | Exceptional 1.0% |