Immigrants from Zimbabwe vs Immigrants from China Disability Age Under 5
COMPARE
Immigrants from Zimbabwe
Immigrants from China
Disability Age Under 5
Disability Age Under 5 Comparison
Immigrants from Zimbabwe
Immigrants from China
1.2%
DISABILITY AGE UNDER 5
77.9/ 100
METRIC RATING
145th/ 347
METRIC RANK
0.96%
DISABILITY AGE UNDER 5
100.0/ 100
METRIC RATING
17th/ 347
METRIC RANK
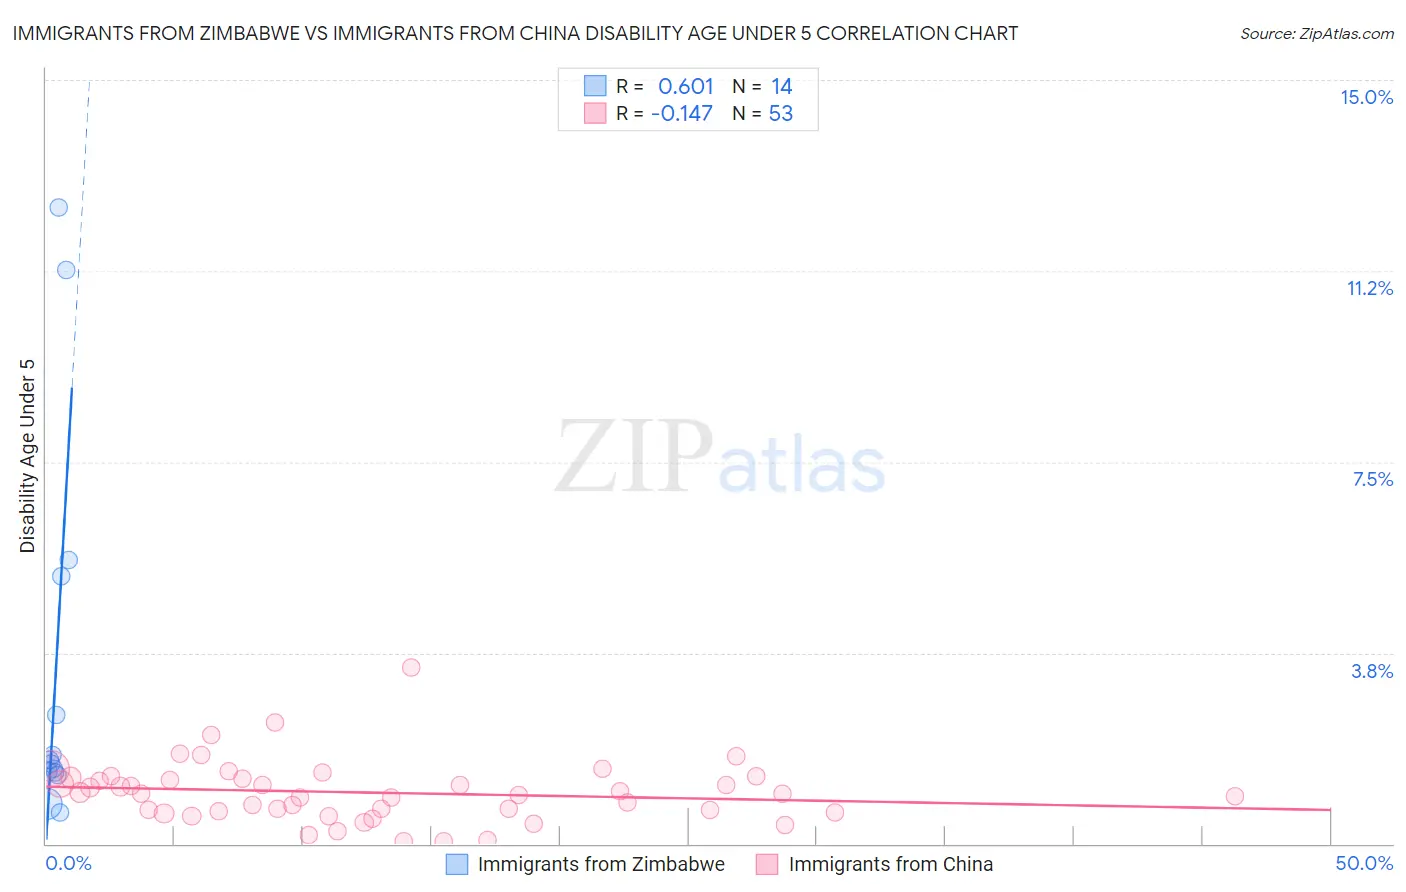
Immigrants from Zimbabwe vs Immigrants from China Disability Age Under 5 Correlation Chart
The statistical analysis conducted on geographies consisting of 89,065,062 people shows a significant positive correlation between the proportion of Immigrants from Zimbabwe and percentage of population with a disability under the age of 5 in the United States with a correlation coefficient (R) of 0.601 and weighted average of 1.2%. Similarly, the statistical analysis conducted on geographies consisting of 235,609,500 people shows a poor negative correlation between the proportion of Immigrants from China and percentage of population with a disability under the age of 5 in the United States with a correlation coefficient (R) of -0.147 and weighted average of 0.96%, a difference of 25.1%.
Disability Age Under 5 Correlation Summary
| Measurement | Immigrants from Zimbabwe | Immigrants from China |
| Minimum | 0.62% | 0.058% |
| Maximum | 12.5% | 3.5% |
| Range | 11.9% | 3.4% |
| Mean | 3.5% | 1.0% |
| Median | 1.6% | 0.97% |
| Interquartile 25% (IQ1) | 1.4% | 0.63% |
| Interquartile 75% (IQ3) | 5.2% | 1.3% |
| Interquartile Range (IQR) | 3.8% | 0.65% |
| Standard Deviation (Sample) | 3.9% | 0.61% |
| Standard Deviation (Population) | 3.7% | 0.60% |
Similar Demographics by Disability Age Under 5
Demographics Similar to Immigrants from Zimbabwe by Disability Age Under 5
In terms of disability age under 5, the demographic groups most similar to Immigrants from Zimbabwe are Samoan (1.2%, a difference of 0.040%), Immigrants from Middle Africa (1.2%, a difference of 0.18%), Immigrants from Colombia (1.2%, a difference of 0.19%), Alsatian (1.2%, a difference of 0.19%), and Icelander (1.2%, a difference of 0.21%).
| Demographics | Rating | Rank | Disability Age Under 5 |
| Immigrants | Czechoslovakia | 82.8 /100 | #138 | Excellent 1.2% |
| New Zealanders | 81.4 /100 | #139 | Excellent 1.2% |
| Somalis | 80.8 /100 | #140 | Excellent 1.2% |
| Immigrants | Honduras | 80.4 /100 | #141 | Excellent 1.2% |
| Immigrants | Colombia | 79.3 /100 | #142 | Good 1.2% |
| Alsatians | 79.3 /100 | #143 | Good 1.2% |
| Immigrants | Middle Africa | 79.3 /100 | #144 | Good 1.2% |
| Immigrants | Zimbabwe | 77.9 /100 | #145 | Good 1.2% |
| Samoans | 77.7 /100 | #146 | Good 1.2% |
| Icelanders | 76.3 /100 | #147 | Good 1.2% |
| Ghanaians | 76.3 /100 | #148 | Good 1.2% |
| Kenyans | 75.9 /100 | #149 | Good 1.2% |
| South Americans | 75.6 /100 | #150 | Good 1.2% |
| Yaqui | 74.8 /100 | #151 | Good 1.2% |
| Hondurans | 72.5 /100 | #152 | Good 1.2% |
Demographics Similar to Immigrants from China by Disability Age Under 5
In terms of disability age under 5, the demographic groups most similar to Immigrants from China are Immigrants from Israel (0.96%, a difference of 0.41%), Immigrants from Barbados (0.97%, a difference of 0.58%), Puget Sound Salish (0.97%, a difference of 0.95%), Nepalese (0.97%, a difference of 1.1%), and Immigrants from Hong Kong (0.95%, a difference of 1.7%).
| Demographics | Rating | Rank | Disability Age Under 5 |
| Marshallese | 100.0 /100 | #10 | Exceptional 0.94% |
| Afghans | 100.0 /100 | #11 | Exceptional 0.94% |
| Immigrants | Grenada | 100.0 /100 | #12 | Exceptional 0.94% |
| Soviet Union | 100.0 /100 | #13 | Exceptional 0.95% |
| Yuman | 100.0 /100 | #14 | Exceptional 0.95% |
| Immigrants | Hong Kong | 100.0 /100 | #15 | Exceptional 0.95% |
| Immigrants | Israel | 100.0 /100 | #16 | Exceptional 0.96% |
| Immigrants | China | 100.0 /100 | #17 | Exceptional 0.96% |
| Immigrants | Barbados | 100.0 /100 | #18 | Exceptional 0.97% |
| Puget Sound Salish | 100.0 /100 | #19 | Exceptional 0.97% |
| Nepalese | 100.0 /100 | #20 | Exceptional 0.97% |
| British West Indians | 100.0 /100 | #21 | Exceptional 0.99% |
| Immigrants | Iran | 100.0 /100 | #22 | Exceptional 1.00% |
| Yakama | 100.0 /100 | #23 | Exceptional 1.00% |
| Indians (Asian) | 100.0 /100 | #24 | Exceptional 1.0% |