Cape Verdean vs Immigrants from China Disability Age Under 5
COMPARE
Cape Verdean
Immigrants from China
Disability Age Under 5
Disability Age Under 5 Comparison
Cape Verdeans
Immigrants from China
1.7%
DISABILITY AGE UNDER 5
0.0/ 100
METRIC RATING
309th/ 347
METRIC RANK
0.96%
DISABILITY AGE UNDER 5
100.0/ 100
METRIC RATING
17th/ 347
METRIC RANK
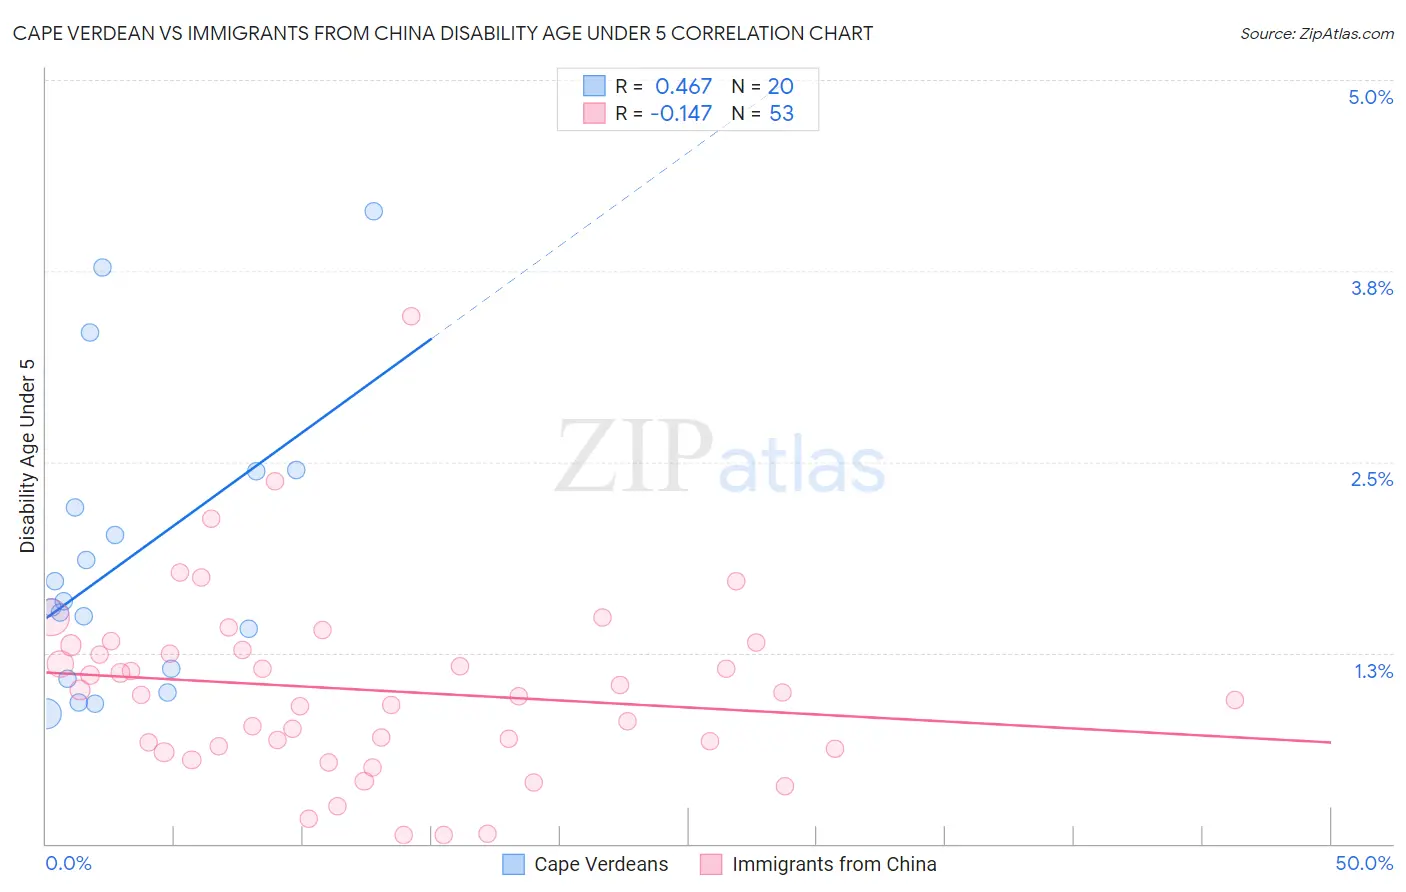
Cape Verdean vs Immigrants from China Disability Age Under 5 Correlation Chart
The statistical analysis conducted on geographies consisting of 80,346,766 people shows a moderate positive correlation between the proportion of Cape Verdeans and percentage of population with a disability under the age of 5 in the United States with a correlation coefficient (R) of 0.467 and weighted average of 1.7%. Similarly, the statistical analysis conducted on geographies consisting of 235,609,500 people shows a poor negative correlation between the proportion of Immigrants from China and percentage of population with a disability under the age of 5 in the United States with a correlation coefficient (R) of -0.147 and weighted average of 0.96%, a difference of 72.4%.
Disability Age Under 5 Correlation Summary
| Measurement | Cape Verdean | Immigrants from China |
| Minimum | 0.85% | 0.058% |
| Maximum | 4.1% | 3.5% |
| Range | 3.3% | 3.4% |
| Mean | 1.9% | 1.0% |
| Median | 1.6% | 0.97% |
| Interquartile 25% (IQ1) | 1.1% | 0.63% |
| Interquartile 75% (IQ3) | 2.3% | 1.3% |
| Interquartile Range (IQR) | 1.2% | 0.65% |
| Standard Deviation (Sample) | 0.95% | 0.61% |
| Standard Deviation (Population) | 0.93% | 0.60% |
Similar Demographics by Disability Age Under 5
Demographics Similar to Cape Verdeans by Disability Age Under 5
In terms of disability age under 5, the demographic groups most similar to Cape Verdeans are White/Caucasian (1.7%, a difference of 0.070%), Navajo (1.6%, a difference of 0.63%), English (1.7%, a difference of 0.66%), Puerto Rican (1.7%, a difference of 0.70%), and Scottish (1.6%, a difference of 0.77%).
| Demographics | Rating | Rank | Disability Age Under 5 |
| Welsh | 0.0 /100 | #302 | Tragic 1.6% |
| Swiss | 0.0 /100 | #303 | Tragic 1.6% |
| Seminole | 0.0 /100 | #304 | Tragic 1.6% |
| Blackfeet | 0.0 /100 | #305 | Tragic 1.6% |
| Creek | 0.0 /100 | #306 | Tragic 1.6% |
| Scottish | 0.0 /100 | #307 | Tragic 1.6% |
| Navajo | 0.0 /100 | #308 | Tragic 1.6% |
| Cape Verdeans | 0.0 /100 | #309 | Tragic 1.7% |
| Whites/Caucasians | 0.0 /100 | #310 | Tragic 1.7% |
| English | 0.0 /100 | #311 | Tragic 1.7% |
| Puerto Ricans | 0.0 /100 | #312 | Tragic 1.7% |
| Celtics | 0.0 /100 | #313 | Tragic 1.7% |
| Norwegians | 0.0 /100 | #314 | Tragic 1.7% |
| Dutch | 0.0 /100 | #315 | Tragic 1.7% |
| Immigrants | Cabo Verde | 0.0 /100 | #316 | Tragic 1.7% |
Demographics Similar to Immigrants from China by Disability Age Under 5
In terms of disability age under 5, the demographic groups most similar to Immigrants from China are Immigrants from Israel (0.96%, a difference of 0.41%), Immigrants from Barbados (0.97%, a difference of 0.58%), Puget Sound Salish (0.97%, a difference of 0.95%), Nepalese (0.97%, a difference of 1.1%), and Immigrants from Hong Kong (0.95%, a difference of 1.7%).
| Demographics | Rating | Rank | Disability Age Under 5 |
| Marshallese | 100.0 /100 | #10 | Exceptional 0.94% |
| Afghans | 100.0 /100 | #11 | Exceptional 0.94% |
| Immigrants | Grenada | 100.0 /100 | #12 | Exceptional 0.94% |
| Soviet Union | 100.0 /100 | #13 | Exceptional 0.95% |
| Yuman | 100.0 /100 | #14 | Exceptional 0.95% |
| Immigrants | Hong Kong | 100.0 /100 | #15 | Exceptional 0.95% |
| Immigrants | Israel | 100.0 /100 | #16 | Exceptional 0.96% |
| Immigrants | China | 100.0 /100 | #17 | Exceptional 0.96% |
| Immigrants | Barbados | 100.0 /100 | #18 | Exceptional 0.97% |
| Puget Sound Salish | 100.0 /100 | #19 | Exceptional 0.97% |
| Nepalese | 100.0 /100 | #20 | Exceptional 0.97% |
| British West Indians | 100.0 /100 | #21 | Exceptional 0.99% |
| Immigrants | Iran | 100.0 /100 | #22 | Exceptional 1.00% |
| Yakama | 100.0 /100 | #23 | Exceptional 1.00% |
| Indians (Asian) | 100.0 /100 | #24 | Exceptional 1.0% |