Kenyan vs Immigrants from Iraq Disability Age Under 5
COMPARE
Kenyan
Immigrants from Iraq
Disability Age Under 5
Disability Age Under 5 Comparison
Kenyans
Immigrants from Iraq
1.2%
DISABILITY AGE UNDER 5
75.9/ 100
METRIC RATING
149th/ 347
METRIC RANK
1.1%
DISABILITY AGE UNDER 5
96.5/ 100
METRIC RATING
97th/ 347
METRIC RANK
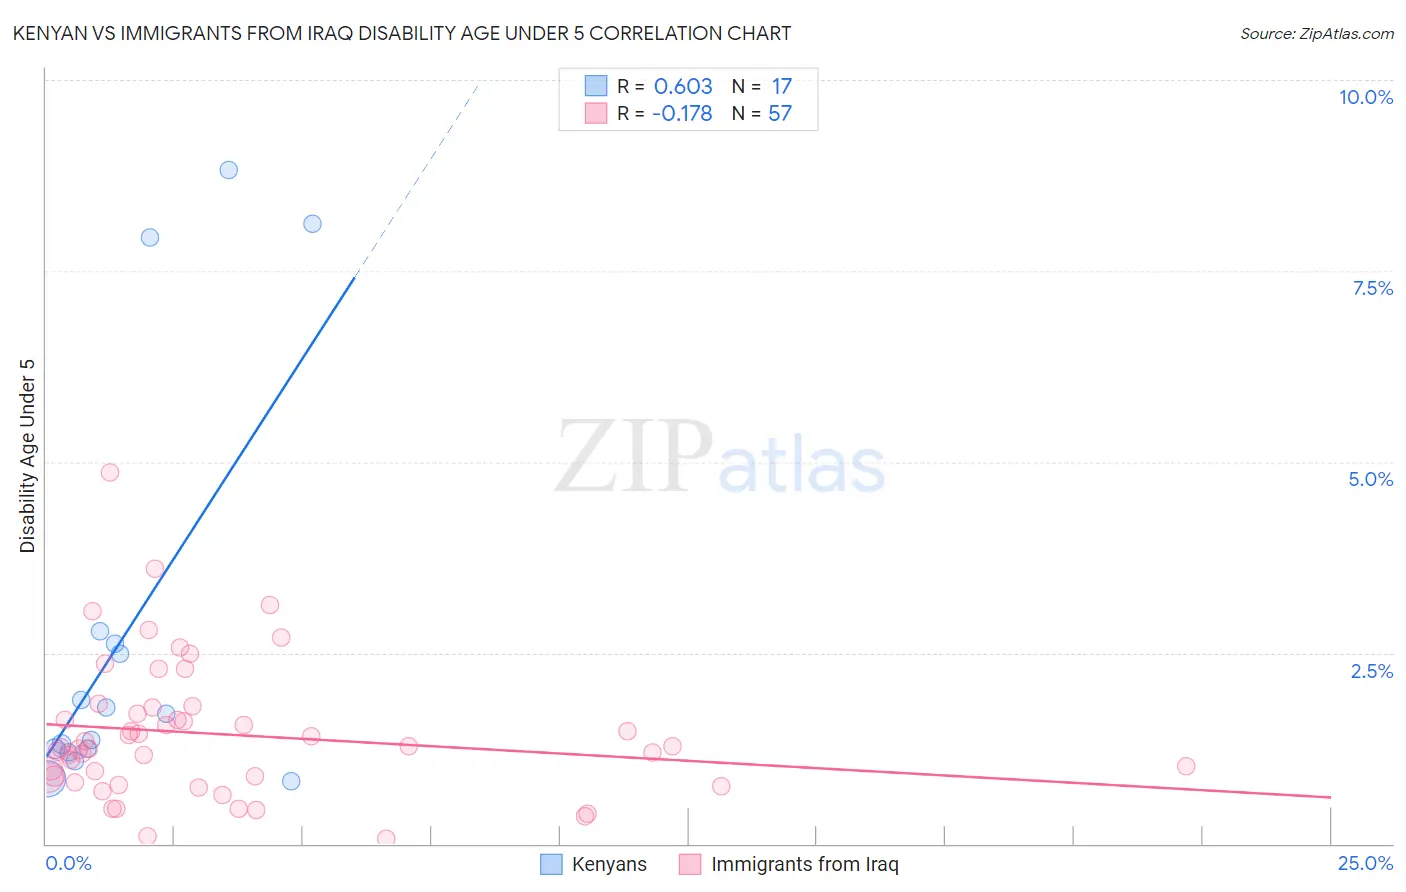
Kenyan vs Immigrants from Iraq Disability Age Under 5 Correlation Chart
The statistical analysis conducted on geographies consisting of 118,614,318 people shows a significant positive correlation between the proportion of Kenyans and percentage of population with a disability under the age of 5 in the United States with a correlation coefficient (R) of 0.603 and weighted average of 1.2%. Similarly, the statistical analysis conducted on geographies consisting of 131,193,910 people shows a poor negative correlation between the proportion of Immigrants from Iraq and percentage of population with a disability under the age of 5 in the United States with a correlation coefficient (R) of -0.178 and weighted average of 1.1%, a difference of 5.3%.
Disability Age Under 5 Correlation Summary
| Measurement | Kenyan | Immigrants from Iraq |
| Minimum | 0.82% | 0.070% |
| Maximum | 8.8% | 4.9% |
| Range | 8.0% | 4.8% |
| Mean | 2.8% | 1.4% |
| Median | 1.7% | 1.3% |
| Interquartile 25% (IQ1) | 1.2% | 0.84% |
| Interquartile 75% (IQ3) | 2.7% | 1.7% |
| Interquartile Range (IQR) | 1.5% | 0.91% |
| Standard Deviation (Sample) | 2.7% | 0.90% |
| Standard Deviation (Population) | 2.6% | 0.89% |
Similar Demographics by Disability Age Under 5
Demographics Similar to Kenyans by Disability Age Under 5
In terms of disability age under 5, the demographic groups most similar to Kenyans are South American (1.2%, a difference of 0.040%), Ghanaian (1.2%, a difference of 0.050%), Icelander (1.2%, a difference of 0.060%), Yaqui (1.2%, a difference of 0.14%), and Samoan (1.2%, a difference of 0.23%).
| Demographics | Rating | Rank | Disability Age Under 5 |
| Immigrants | Colombia | 79.3 /100 | #142 | Good 1.2% |
| Alsatians | 79.3 /100 | #143 | Good 1.2% |
| Immigrants | Middle Africa | 79.3 /100 | #144 | Good 1.2% |
| Immigrants | Zimbabwe | 77.9 /100 | #145 | Good 1.2% |
| Samoans | 77.7 /100 | #146 | Good 1.2% |
| Icelanders | 76.3 /100 | #147 | Good 1.2% |
| Ghanaians | 76.3 /100 | #148 | Good 1.2% |
| Kenyans | 75.9 /100 | #149 | Good 1.2% |
| South Americans | 75.6 /100 | #150 | Good 1.2% |
| Yaqui | 74.8 /100 | #151 | Good 1.2% |
| Hondurans | 72.5 /100 | #152 | Good 1.2% |
| Immigrants | Thailand | 69.4 /100 | #153 | Good 1.2% |
| Uruguayans | 68.8 /100 | #154 | Good 1.2% |
| Immigrants | Ghana | 68.7 /100 | #155 | Good 1.2% |
| Hawaiians | 68.5 /100 | #156 | Good 1.2% |
Demographics Similar to Immigrants from Iraq by Disability Age Under 5
In terms of disability age under 5, the demographic groups most similar to Immigrants from Iraq are Immigrants from South Eastern Asia (1.1%, a difference of 0.010%), Mongolian (1.1%, a difference of 0.10%), Dominican (1.1%, a difference of 0.14%), Nicaraguan (1.1%, a difference of 0.17%), and Immigrants from Moldova (1.1%, a difference of 0.20%).
| Demographics | Rating | Rank | Disability Age Under 5 |
| Chinese | 97.2 /100 | #90 | Exceptional 1.1% |
| Albanians | 97.2 /100 | #91 | Exceptional 1.1% |
| Immigrants | Cuba | 97.0 /100 | #92 | Exceptional 1.1% |
| Spanish Americans | 96.9 /100 | #93 | Exceptional 1.1% |
| Sri Lankans | 96.8 /100 | #94 | Exceptional 1.1% |
| Immigrants | Moldova | 96.8 /100 | #95 | Exceptional 1.1% |
| Mongolians | 96.6 /100 | #96 | Exceptional 1.1% |
| Immigrants | Iraq | 96.5 /100 | #97 | Exceptional 1.1% |
| Immigrants | South Eastern Asia | 96.5 /100 | #98 | Exceptional 1.1% |
| Dominicans | 96.3 /100 | #99 | Exceptional 1.1% |
| Nicaraguans | 96.3 /100 | #100 | Exceptional 1.1% |
| Immigrants | Uganda | 96.1 /100 | #101 | Exceptional 1.1% |
| Immigrants | Morocco | 96.0 /100 | #102 | Exceptional 1.2% |
| Immigrants | Nicaragua | 96.0 /100 | #103 | Exceptional 1.2% |
| Indonesians | 95.9 /100 | #104 | Exceptional 1.2% |