Jordanian vs Marshallese Hearing Disability
COMPARE
Jordanian
Marshallese
Hearing Disability
Hearing Disability Comparison
Jordanians
Marshallese
2.8%
HEARING DISABILITY
89.5/ 100
METRIC RATING
120th/ 347
METRIC RANK
3.8%
HEARING DISABILITY
0.0/ 100
METRIC RATING
306th/ 347
METRIC RANK
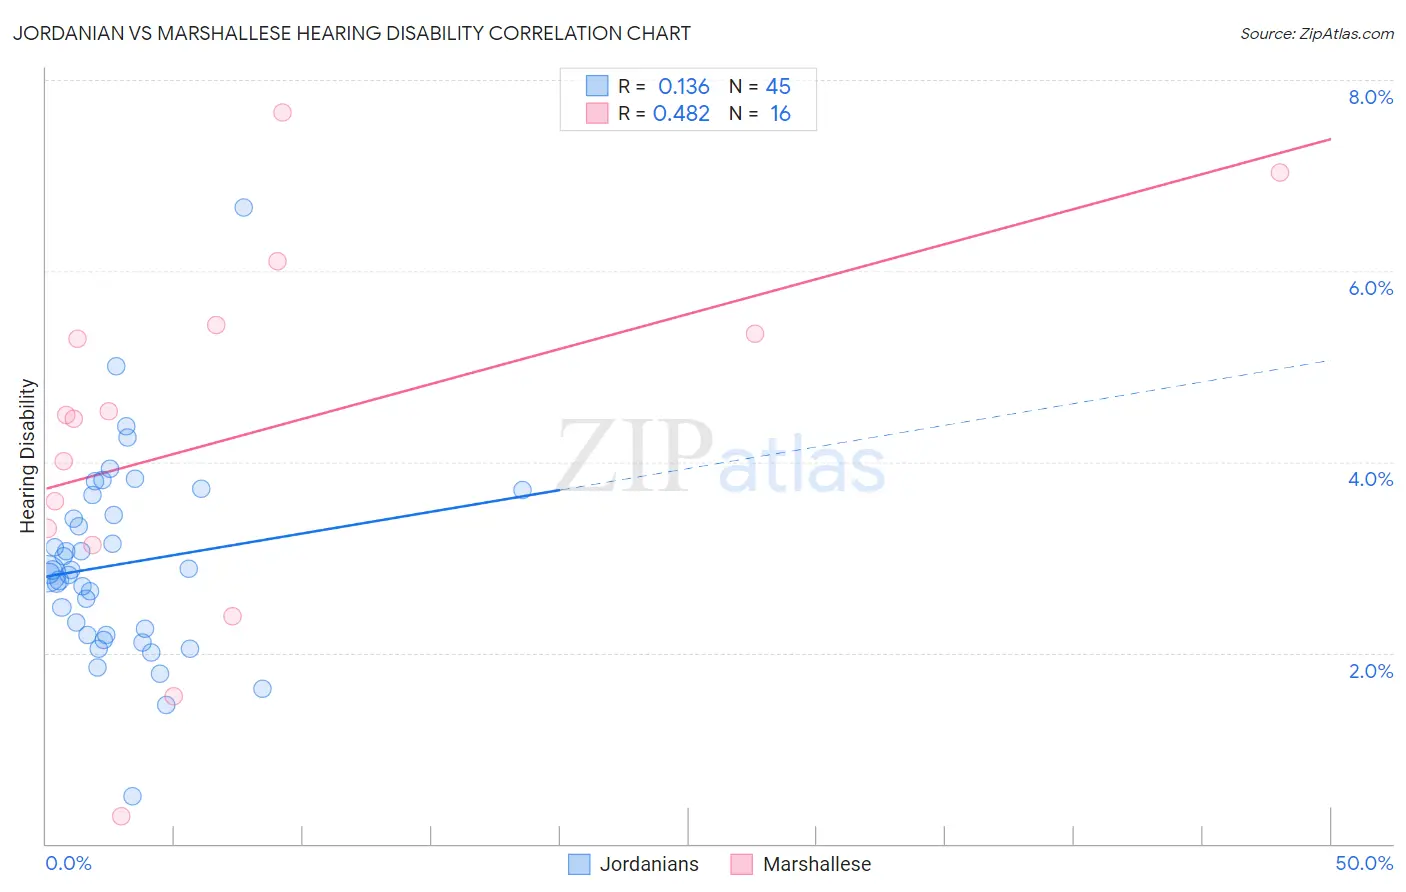
Jordanian vs Marshallese Hearing Disability Correlation Chart
The statistical analysis conducted on geographies consisting of 166,401,829 people shows a poor positive correlation between the proportion of Jordanians and percentage of population with hearing disability in the United States with a correlation coefficient (R) of 0.136 and weighted average of 2.8%. Similarly, the statistical analysis conducted on geographies consisting of 14,761,315 people shows a moderate positive correlation between the proportion of Marshallese and percentage of population with hearing disability in the United States with a correlation coefficient (R) of 0.482 and weighted average of 3.8%, a difference of 33.9%.
Hearing Disability Correlation Summary
| Measurement | Jordanian | Marshallese |
| Minimum | 0.50% | 0.29% |
| Maximum | 6.7% | 7.7% |
| Range | 6.2% | 7.4% |
| Mean | 2.9% | 4.3% |
| Median | 2.8% | 4.5% |
| Interquartile 25% (IQ1) | 2.2% | 3.2% |
| Interquartile 75% (IQ3) | 3.5% | 5.4% |
| Interquartile Range (IQR) | 1.4% | 2.2% |
| Standard Deviation (Sample) | 1.0% | 1.9% |
| Standard Deviation (Population) | 1.0% | 1.9% |
Similar Demographics by Hearing Disability
Demographics Similar to Jordanians by Hearing Disability
In terms of hearing disability, the demographic groups most similar to Jordanians are Cuban (2.8%, a difference of 0.030%), Kenyan (2.8%, a difference of 0.090%), Zimbabwean (2.8%, a difference of 0.11%), Immigrants from Liberia (2.8%, a difference of 0.13%), and Liberian (2.8%, a difference of 0.13%).
| Demographics | Rating | Rank | Hearing Disability |
| Immigrants | Belarus | 91.6 /100 | #113 | Exceptional 2.8% |
| Cambodians | 91.1 /100 | #114 | Exceptional 2.8% |
| Immigrants | Latin America | 90.5 /100 | #115 | Exceptional 2.8% |
| Immigrants | Immigrants | 90.3 /100 | #116 | Exceptional 2.8% |
| Immigrants | Liberia | 90.0 /100 | #117 | Excellent 2.8% |
| Zimbabweans | 89.9 /100 | #118 | Excellent 2.8% |
| Kenyans | 89.8 /100 | #119 | Excellent 2.8% |
| Jordanians | 89.5 /100 | #120 | Excellent 2.8% |
| Cubans | 89.4 /100 | #121 | Excellent 2.8% |
| Liberians | 89.0 /100 | #122 | Excellent 2.8% |
| Immigrants | Zaire | 88.6 /100 | #123 | Excellent 2.9% |
| Bahamians | 88.6 /100 | #124 | Excellent 2.9% |
| Immigrants | Albania | 88.5 /100 | #125 | Excellent 2.9% |
| Immigrants | Sudan | 87.8 /100 | #126 | Excellent 2.9% |
| South American Indians | 86.9 /100 | #127 | Excellent 2.9% |
Demographics Similar to Marshallese by Hearing Disability
In terms of hearing disability, the demographic groups most similar to Marshallese are French Canadian (3.8%, a difference of 0.12%), Ottawa (3.8%, a difference of 0.56%), Scotch-Irish (3.8%, a difference of 0.64%), English (3.8%, a difference of 0.86%), and Cree (3.8%, a difference of 0.95%).
| Demographics | Rating | Rank | Hearing Disability |
| Germans | 0.0 /100 | #299 | Tragic 3.7% |
| Scottish | 0.0 /100 | #300 | Tragic 3.7% |
| Pennsylvania Germans | 0.0 /100 | #301 | Tragic 3.7% |
| Dutch | 0.0 /100 | #302 | Tragic 3.7% |
| Menominee | 0.0 /100 | #303 | Tragic 3.7% |
| French | 0.0 /100 | #304 | Tragic 3.8% |
| English | 0.0 /100 | #305 | Tragic 3.8% |
| Marshallese | 0.0 /100 | #306 | Tragic 3.8% |
| French Canadians | 0.0 /100 | #307 | Tragic 3.8% |
| Ottawa | 0.0 /100 | #308 | Tragic 3.8% |
| Scotch-Irish | 0.0 /100 | #309 | Tragic 3.8% |
| Cree | 0.0 /100 | #310 | Tragic 3.8% |
| Americans | 0.0 /100 | #311 | Tragic 3.9% |
| Cajuns | 0.0 /100 | #312 | Tragic 3.9% |
| Hopi | 0.0 /100 | #313 | Tragic 3.9% |