Japanese vs Thai 8th Grade
COMPARE
Japanese
Thai
8th Grade
8th Grade Comparison
Japanese
Thais
93.6%
8TH GRADE
0.0/ 100
METRIC RATING
310th/ 347
METRIC RANK
96.4%
8TH GRADE
98.9/ 100
METRIC RATING
91st/ 347
METRIC RANK
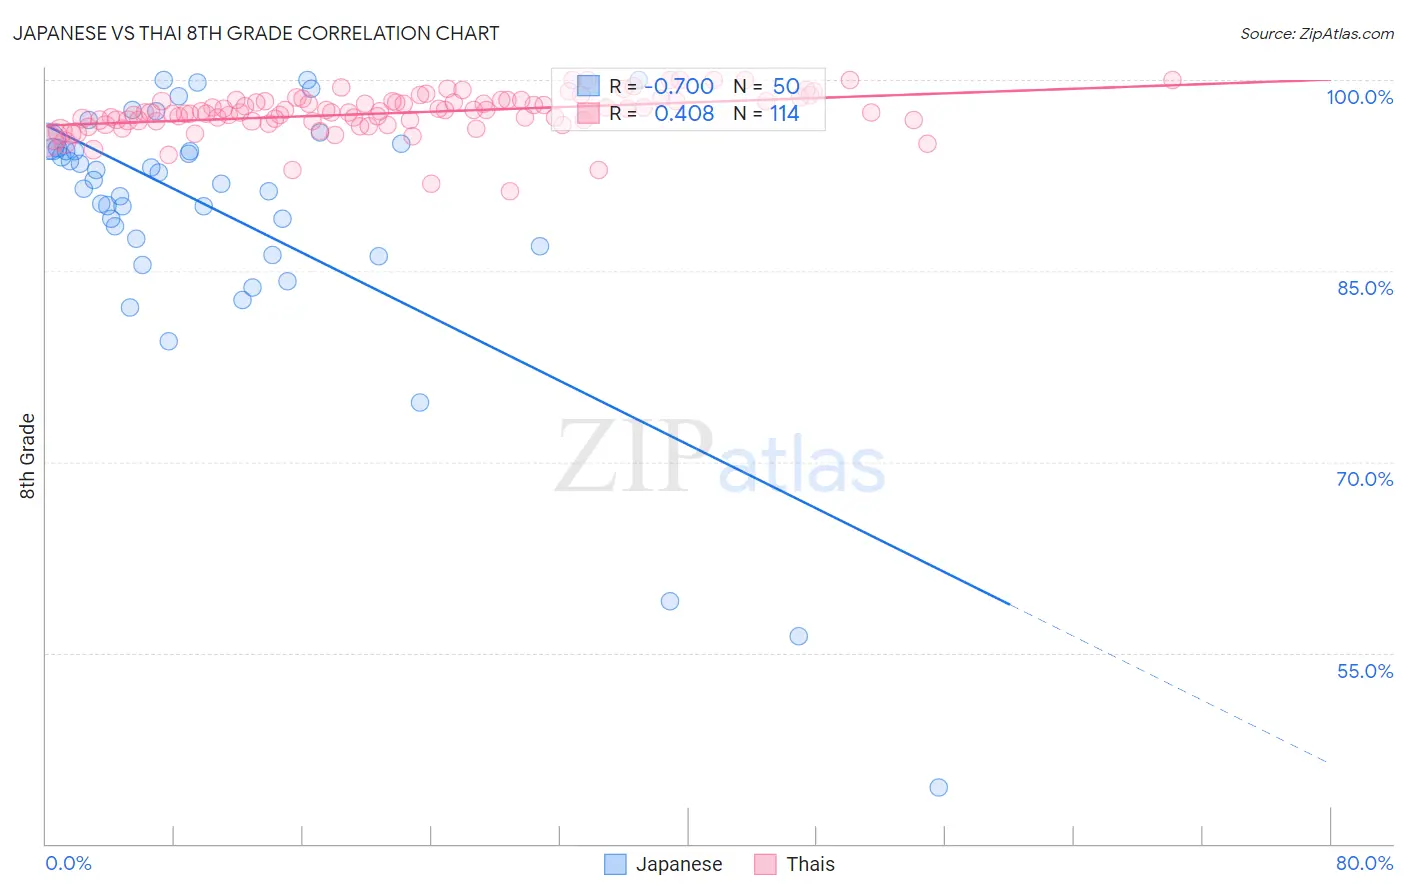
Japanese vs Thai 8th Grade Correlation Chart
The statistical analysis conducted on geographies consisting of 249,183,224 people shows a strong negative correlation between the proportion of Japanese and percentage of population with at least 8th grade education in the United States with a correlation coefficient (R) of -0.700 and weighted average of 93.6%. Similarly, the statistical analysis conducted on geographies consisting of 475,814,962 people shows a moderate positive correlation between the proportion of Thais and percentage of population with at least 8th grade education in the United States with a correlation coefficient (R) of 0.408 and weighted average of 96.4%, a difference of 3.0%.
8th Grade Correlation Summary
| Measurement | Japanese | Thai |
| Minimum | 44.4% | 91.3% |
| Maximum | 100.0% | 100.0% |
| Range | 55.6% | 8.7% |
| Mean | 89.3% | 97.4% |
| Median | 92.0% | 97.5% |
| Interquartile 25% (IQ1) | 86.9% | 96.8% |
| Interquartile 75% (IQ3) | 94.6% | 98.4% |
| Interquartile Range (IQR) | 7.8% | 1.6% |
| Standard Deviation (Sample) | 10.8% | 1.6% |
| Standard Deviation (Population) | 10.7% | 1.6% |
Similar Demographics by 8th Grade
Demographics Similar to Japanese by 8th Grade
In terms of 8th grade, the demographic groups most similar to Japanese are Immigrants (93.6%, a difference of 0.0%), Immigrants from Bangladesh (93.6%, a difference of 0.0%), Ecuadorian (93.6%, a difference of 0.030%), Cape Verdean (93.5%, a difference of 0.040%), and Immigrants from Caribbean (93.5%, a difference of 0.070%).
| Demographics | Rating | Rank | 8th Grade |
| Immigrants | Dominica | 0.0 /100 | #303 | Tragic 94.0% |
| Guyanese | 0.0 /100 | #304 | Tragic 93.9% |
| Immigrants | Haiti | 0.0 /100 | #305 | Tragic 93.9% |
| Immigrants | Guyana | 0.0 /100 | #306 | Tragic 93.8% |
| Immigrants | Portugal | 0.0 /100 | #307 | Tragic 93.8% |
| Ecuadorians | 0.0 /100 | #308 | Tragic 93.6% |
| Immigrants | Immigrants | 0.0 /100 | #309 | Tragic 93.6% |
| Japanese | 0.0 /100 | #310 | Tragic 93.6% |
| Immigrants | Bangladesh | 0.0 /100 | #311 | Tragic 93.6% |
| Cape Verdeans | 0.0 /100 | #312 | Tragic 93.5% |
| Immigrants | Caribbean | 0.0 /100 | #313 | Tragic 93.5% |
| Immigrants | Vietnam | 0.0 /100 | #314 | Tragic 93.5% |
| Vietnamese | 0.0 /100 | #315 | Tragic 93.5% |
| Immigrants | Cambodia | 0.0 /100 | #316 | Tragic 93.3% |
| Immigrants | Ecuador | 0.0 /100 | #317 | Tragic 93.3% |
Demographics Similar to Thais by 8th Grade
In terms of 8th grade, the demographic groups most similar to Thais are Immigrants from Sweden (96.4%, a difference of 0.0%), Menominee (96.4%, a difference of 0.0%), Immigrants from Denmark (96.4%, a difference of 0.0%), Chickasaw (96.4%, a difference of 0.010%), and Immigrants from Singapore (96.4%, a difference of 0.010%).
| Demographics | Rating | Rank | 8th Grade |
| Immigrants | Belgium | 99.1 /100 | #84 | Exceptional 96.5% |
| Immigrants | South Africa | 99.1 /100 | #85 | Exceptional 96.5% |
| Cherokee | 99.0 /100 | #86 | Exceptional 96.5% |
| Immigrants | Australia | 99.0 /100 | #87 | Exceptional 96.5% |
| Immigrants | Western Europe | 99.0 /100 | #88 | Exceptional 96.4% |
| Chickasaw | 98.9 /100 | #89 | Exceptional 96.4% |
| Immigrants | Sweden | 98.9 /100 | #90 | Exceptional 96.4% |
| Thais | 98.9 /100 | #91 | Exceptional 96.4% |
| Menominee | 98.9 /100 | #92 | Exceptional 96.4% |
| Immigrants | Denmark | 98.8 /100 | #93 | Exceptional 96.4% |
| Immigrants | Singapore | 98.8 /100 | #94 | Exceptional 96.4% |
| German Russians | 98.8 /100 | #95 | Exceptional 96.4% |
| Potawatomi | 98.7 /100 | #96 | Exceptional 96.4% |
| Osage | 98.7 /100 | #97 | Exceptional 96.4% |
| Immigrants | Germany | 98.7 /100 | #98 | Exceptional 96.4% |