Japanese vs Cambodian Male Disability
COMPARE
Japanese
Cambodian
Male Disability
Male Disability Comparison
Japanese
Cambodians
11.7%
MALE DISABILITY
3.1/ 100
METRIC RATING
224th/ 347
METRIC RANK
10.3%
MALE DISABILITY
99.7/ 100
METRIC RATING
46th/ 347
METRIC RANK
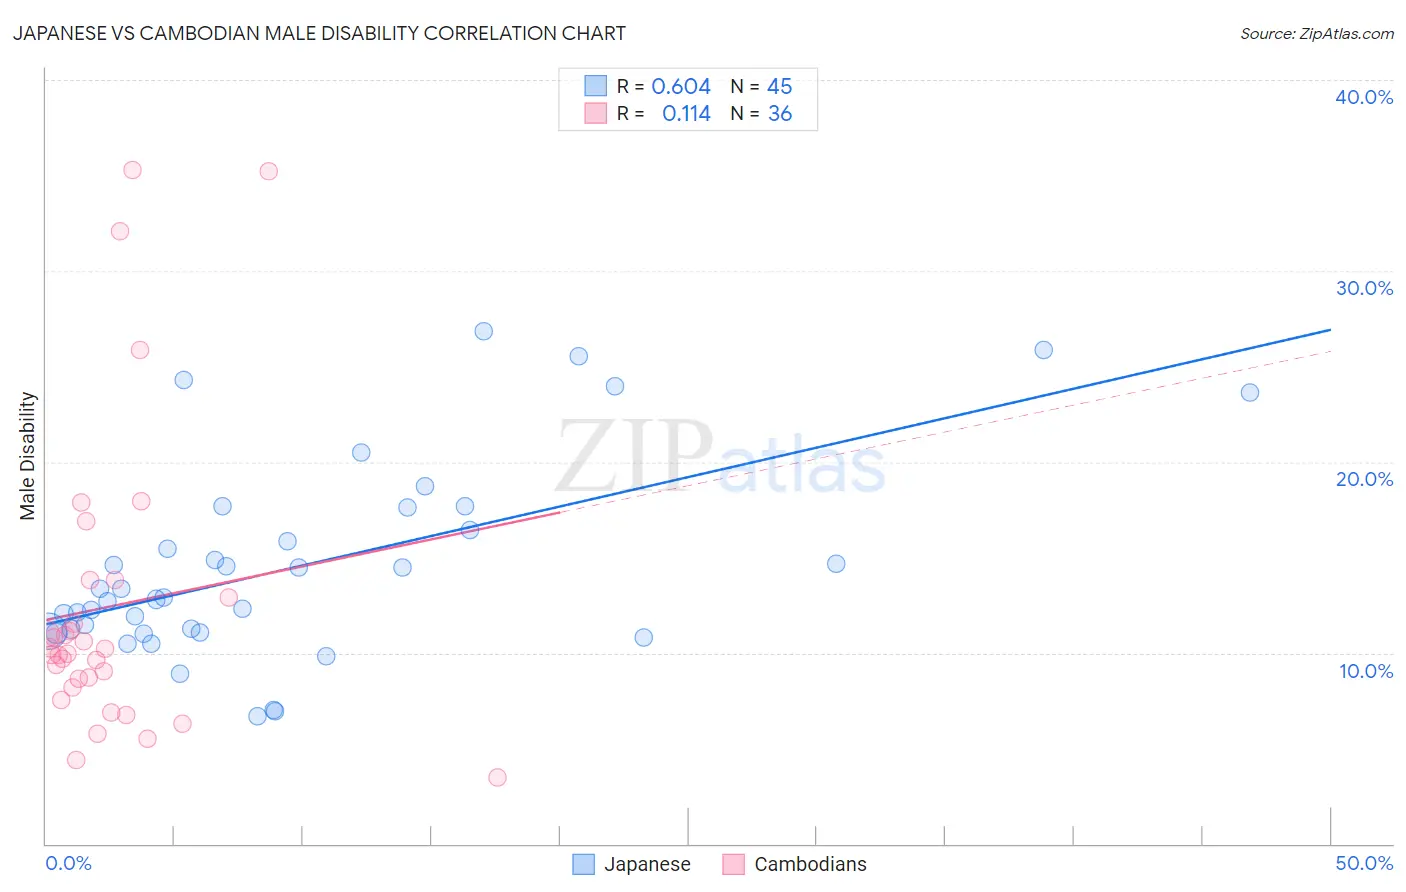
Japanese vs Cambodian Male Disability Correlation Chart
The statistical analysis conducted on geographies consisting of 249,159,975 people shows a significant positive correlation between the proportion of Japanese and percentage of males with a disability in the United States with a correlation coefficient (R) of 0.604 and weighted average of 11.7%. Similarly, the statistical analysis conducted on geographies consisting of 102,516,296 people shows a poor positive correlation between the proportion of Cambodians and percentage of males with a disability in the United States with a correlation coefficient (R) of 0.114 and weighted average of 10.3%, a difference of 13.9%.
Male Disability Correlation Summary
| Measurement | Japanese | Cambodian |
| Minimum | 6.7% | 3.5% |
| Maximum | 26.9% | 35.3% |
| Range | 20.2% | 31.8% |
| Mean | 14.5% | 12.4% |
| Median | 12.9% | 10.1% |
| Interquartile 25% (IQ1) | 11.1% | 8.4% |
| Interquartile 75% (IQ3) | 17.0% | 13.4% |
| Interquartile Range (IQR) | 5.9% | 4.9% |
| Standard Deviation (Sample) | 5.1% | 7.9% |
| Standard Deviation (Population) | 5.1% | 7.8% |
Similar Demographics by Male Disability
Demographics Similar to Japanese by Male Disability
In terms of male disability, the demographic groups most similar to Japanese are Liberian (11.8%, a difference of 0.010%), Immigrants from Bahamas (11.7%, a difference of 0.020%), Alsatian (11.7%, a difference of 0.11%), Subsaharan African (11.8%, a difference of 0.13%), and Immigrants from Congo (11.7%, a difference of 0.26%).
| Demographics | Rating | Rank | Male Disability |
| Immigrants | Dominica | 4.6 /100 | #217 | Tragic 11.7% |
| Immigrants | England | 4.0 /100 | #218 | Tragic 11.7% |
| Panamanians | 3.8 /100 | #219 | Tragic 11.7% |
| Immigrants | Western Europe | 3.8 /100 | #220 | Tragic 11.7% |
| Immigrants | Congo | 3.7 /100 | #221 | Tragic 11.7% |
| Alsatians | 3.3 /100 | #222 | Tragic 11.7% |
| Immigrants | Bahamas | 3.2 /100 | #223 | Tragic 11.7% |
| Japanese | 3.1 /100 | #224 | Tragic 11.7% |
| Liberians | 3.1 /100 | #225 | Tragic 11.8% |
| Sub-Saharan Africans | 2.8 /100 | #226 | Tragic 11.8% |
| Austrians | 2.5 /100 | #227 | Tragic 11.8% |
| Hispanics or Latinos | 2.3 /100 | #228 | Tragic 11.8% |
| Bermudans | 2.3 /100 | #229 | Tragic 11.8% |
| Croatians | 2.1 /100 | #230 | Tragic 11.8% |
| Dominicans | 1.8 /100 | #231 | Tragic 11.8% |
Demographics Similar to Cambodians by Male Disability
In terms of male disability, the demographic groups most similar to Cambodians are Immigrants from Peru (10.3%, a difference of 0.040%), Israeli (10.3%, a difference of 0.070%), Turkish (10.3%, a difference of 0.080%), Immigrants from El Salvador (10.3%, a difference of 0.090%), and Immigrants from Spain (10.3%, a difference of 0.13%).
| Demographics | Rating | Rank | Male Disability |
| Afghans | 99.8 /100 | #39 | Exceptional 10.2% |
| Immigrants | Nepal | 99.8 /100 | #40 | Exceptional 10.3% |
| Taiwanese | 99.8 /100 | #41 | Exceptional 10.3% |
| Mongolians | 99.7 /100 | #42 | Exceptional 10.3% |
| Immigrants | Bangladesh | 99.7 /100 | #43 | Exceptional 10.3% |
| Immigrants | El Salvador | 99.7 /100 | #44 | Exceptional 10.3% |
| Turks | 99.7 /100 | #45 | Exceptional 10.3% |
| Cambodians | 99.7 /100 | #46 | Exceptional 10.3% |
| Immigrants | Peru | 99.7 /100 | #47 | Exceptional 10.3% |
| Israelis | 99.7 /100 | #48 | Exceptional 10.3% |
| Immigrants | Spain | 99.7 /100 | #49 | Exceptional 10.3% |
| South Americans | 99.6 /100 | #50 | Exceptional 10.3% |
| Salvadorans | 99.6 /100 | #51 | Exceptional 10.4% |
| Immigrants | Saudi Arabia | 99.6 /100 | #52 | Exceptional 10.4% |
| Immigrants | Uzbekistan | 99.6 /100 | #53 | Exceptional 10.4% |