Japanese vs Immigrants from Kuwait Unemployment Among Seniors over 75 years
COMPARE
Japanese
Immigrants from Kuwait
Unemployment Among Seniors over 75 years
Unemployment Among Seniors over 75 years Comparison
Japanese
Immigrants from Kuwait
8.3%
UNEMPLOYMENT AMONG SENIORS OVER 75 YEARS
97.5/ 100
METRIC RATING
119th/ 347
METRIC RANK
8.5%
UNEMPLOYMENT AMONG SENIORS OVER 75 YEARS
90.5/ 100
METRIC RATING
137th/ 347
METRIC RANK
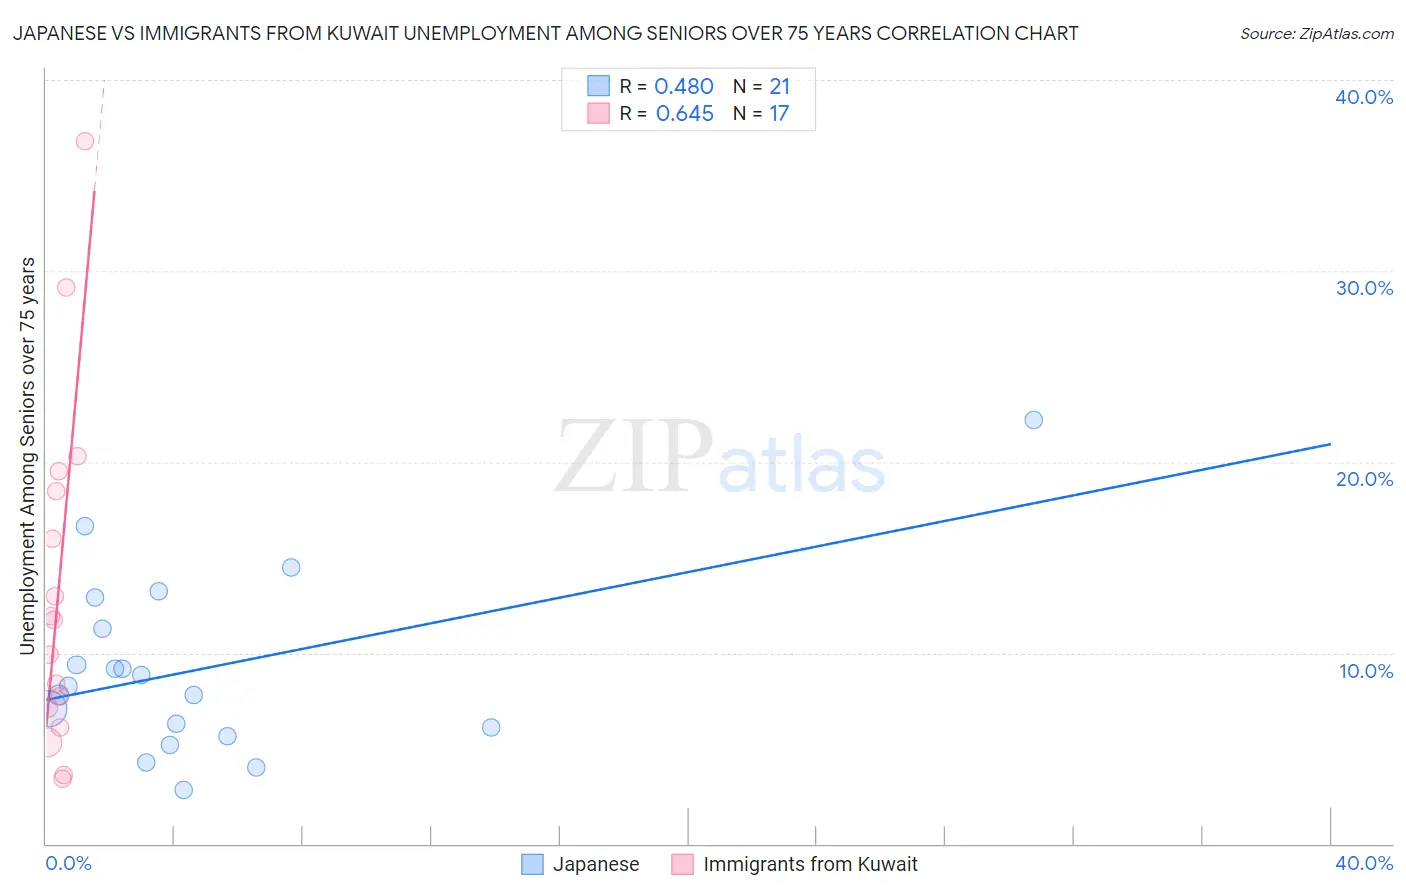
Japanese vs Immigrants from Kuwait Unemployment Among Seniors over 75 years Correlation Chart
The statistical analysis conducted on geographies consisting of 149,299,212 people shows a moderate positive correlation between the proportion of Japanese and unemployment rate among seniors over the age of 75 in the United States with a correlation coefficient (R) of 0.480 and weighted average of 8.3%. Similarly, the statistical analysis conducted on geographies consisting of 97,784,718 people shows a significant positive correlation between the proportion of Immigrants from Kuwait and unemployment rate among seniors over the age of 75 in the United States with a correlation coefficient (R) of 0.645 and weighted average of 8.5%, a difference of 1.9%.
Unemployment Among Seniors over 75 years Correlation Summary
| Measurement | Japanese | Immigrants from Kuwait |
| Minimum | 2.8% | 3.4% |
| Maximum | 22.2% | 36.8% |
| Range | 19.4% | 33.4% |
| Mean | 9.2% | 13.4% |
| Median | 8.2% | 11.7% |
| Interquartile 25% (IQ1) | 5.8% | 6.6% |
| Interquartile 75% (IQ3) | 12.1% | 19.0% |
| Interquartile Range (IQR) | 6.2% | 12.3% |
| Standard Deviation (Sample) | 4.7% | 9.1% |
| Standard Deviation (Population) | 4.6% | 8.9% |
Demographics Similar to Japanese and Immigrants from Kuwait by Unemployment Among Seniors over 75 years
In terms of unemployment among seniors over 75 years, the demographic groups most similar to Japanese are Immigrants from Asia (8.3%, a difference of 0.020%), Immigrants from Croatia (8.3%, a difference of 0.15%), Immigrants from Russia (8.3%, a difference of 0.21%), Immigrants from Middle Africa (8.3%, a difference of 0.27%), and Immigrants from Nepal (8.3%, a difference of 0.29%). Similarly, the demographic groups most similar to Immigrants from Kuwait are Immigrants from Trinidad and Tobago (8.5%, a difference of 0.040%), Immigrants from Bulgaria (8.5%, a difference of 0.14%), Haitian (8.5%, a difference of 0.15%), Immigrants from Czechoslovakia (8.4%, a difference of 0.54%), and Serbian (8.4%, a difference of 0.62%).
| Demographics | Rating | Rank | Unemployment Among Seniors over 75 years |
| Immigrants | Middle Africa | 97.9 /100 | #118 | Exceptional 8.3% |
| Japanese | 97.5 /100 | #119 | Exceptional 8.3% |
| Immigrants | Asia | 97.4 /100 | #120 | Exceptional 8.3% |
| Immigrants | Croatia | 97.2 /100 | #121 | Exceptional 8.3% |
| Immigrants | Russia | 97.1 /100 | #122 | Exceptional 8.3% |
| Immigrants | Nepal | 96.9 /100 | #123 | Exceptional 8.3% |
| Thais | 96.8 /100 | #124 | Exceptional 8.3% |
| Immigrants | Moldova | 96.7 /100 | #125 | Exceptional 8.3% |
| Belizeans | 96.3 /100 | #126 | Exceptional 8.4% |
| Hondurans | 96.2 /100 | #127 | Exceptional 8.4% |
| Native Hawaiians | 96.1 /100 | #128 | Exceptional 8.4% |
| Ghanaians | 96.0 /100 | #129 | Exceptional 8.4% |
| Apache | 95.2 /100 | #130 | Exceptional 8.4% |
| German Russians | 94.9 /100 | #131 | Exceptional 8.4% |
| Chileans | 93.8 /100 | #132 | Exceptional 8.4% |
| Serbians | 93.7 /100 | #133 | Exceptional 8.4% |
| Immigrants | Czechoslovakia | 93.4 /100 | #134 | Exceptional 8.4% |
| Haitians | 91.4 /100 | #135 | Exceptional 8.5% |
| Immigrants | Trinidad and Tobago | 90.8 /100 | #136 | Exceptional 8.5% |
| Immigrants | Kuwait | 90.5 /100 | #137 | Exceptional 8.5% |
| Immigrants | Bulgaria | 89.6 /100 | #138 | Excellent 8.5% |