Jamaican vs British West Indian Disability Age Under 5
COMPARE
Jamaican
British West Indian
Disability Age Under 5
Disability Age Under 5 Comparison
Jamaicans
British West Indians
1.3%
DISABILITY AGE UNDER 5
30.7/ 100
METRIC RATING
199th/ 347
METRIC RANK
0.99%
DISABILITY AGE UNDER 5
100.0/ 100
METRIC RATING
21st/ 347
METRIC RANK
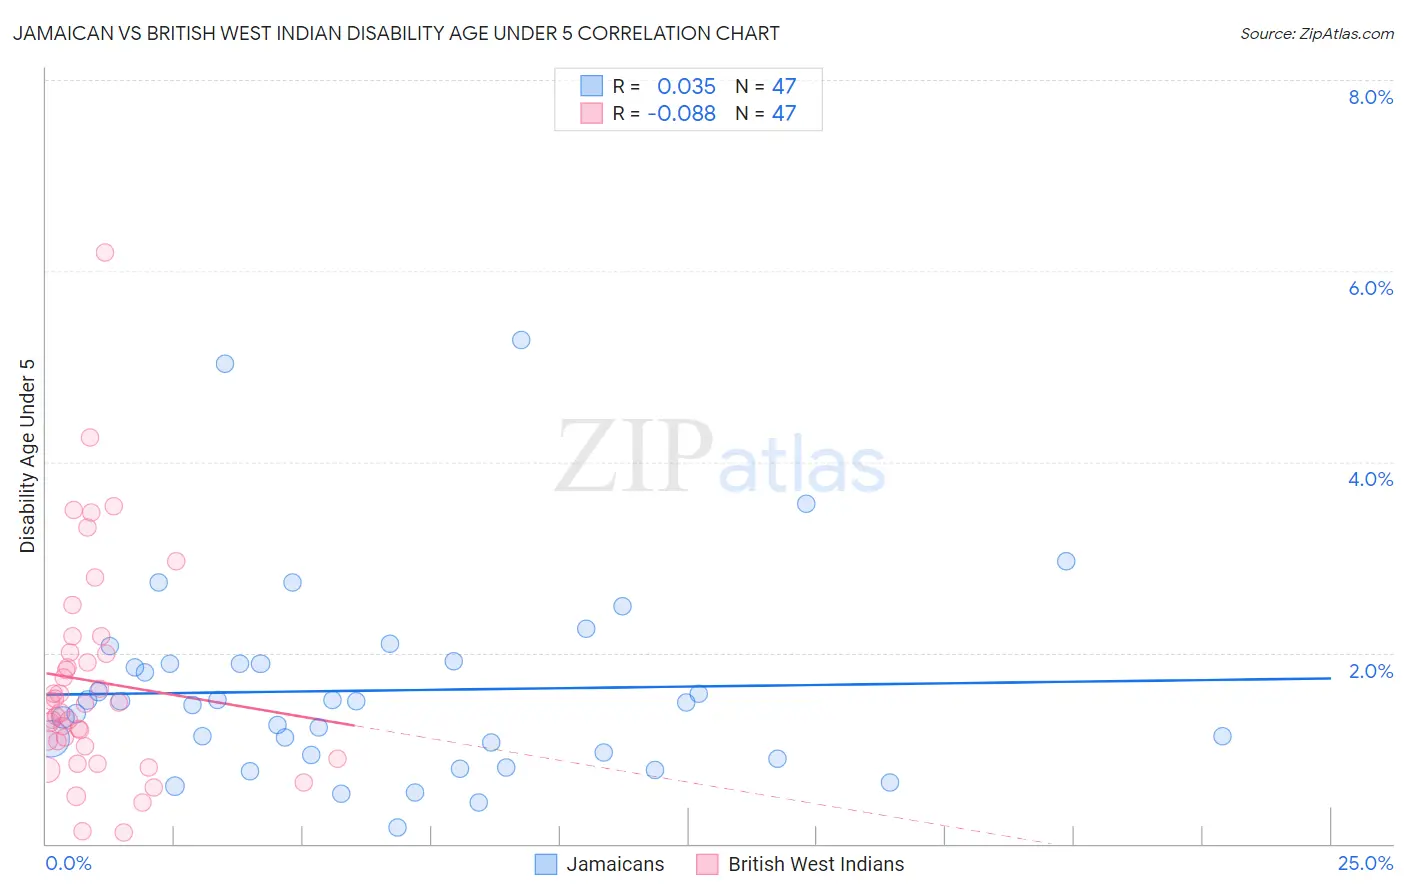
Jamaican vs British West Indian Disability Age Under 5 Correlation Chart
The statistical analysis conducted on geographies consisting of 204,154,709 people shows no correlation between the proportion of Jamaicans and percentage of population with a disability under the age of 5 in the United States with a correlation coefficient (R) of 0.035 and weighted average of 1.3%. Similarly, the statistical analysis conducted on geographies consisting of 105,175,944 people shows a slight negative correlation between the proportion of British West Indians and percentage of population with a disability under the age of 5 in the United States with a correlation coefficient (R) of -0.088 and weighted average of 0.99%, a difference of 27.5%.
Disability Age Under 5 Correlation Summary
| Measurement | Jamaican | British West Indian |
| Minimum | 0.17% | 0.12% |
| Maximum | 5.3% | 6.2% |
| Range | 5.1% | 6.1% |
| Mean | 1.6% | 1.7% |
| Median | 1.5% | 1.5% |
| Interquartile 25% (IQ1) | 0.93% | 1.0% |
| Interquartile 75% (IQ3) | 1.9% | 2.0% |
| Interquartile Range (IQR) | 0.95% | 0.98% |
| Standard Deviation (Sample) | 1.0% | 1.1% |
| Standard Deviation (Population) | 1.0% | 1.1% |
Similar Demographics by Disability Age Under 5
Demographics Similar to Jamaicans by Disability Age Under 5
In terms of disability age under 5, the demographic groups most similar to Jamaicans are Immigrants from Norway (1.3%, a difference of 0.040%), Immigrants from Somalia (1.3%, a difference of 0.070%), Immigrants from Belgium (1.3%, a difference of 0.080%), U.S. Virgin Islander (1.3%, a difference of 0.38%), and Immigrants from Lithuania (1.3%, a difference of 0.38%).
| Demographics | Rating | Rank | Disability Age Under 5 |
| Immigrants | Bosnia and Herzegovina | 36.5 /100 | #192 | Fair 1.3% |
| Immigrants | Sierra Leone | 36.5 /100 | #193 | Fair 1.3% |
| Immigrants | North Macedonia | 34.7 /100 | #194 | Fair 1.3% |
| U.S. Virgin Islanders | 34.4 /100 | #195 | Fair 1.3% |
| Immigrants | Belgium | 31.4 /100 | #196 | Fair 1.3% |
| Immigrants | Somalia | 31.3 /100 | #197 | Fair 1.3% |
| Immigrants | Norway | 31.1 /100 | #198 | Fair 1.3% |
| Jamaicans | 30.7 /100 | #199 | Fair 1.3% |
| Immigrants | Lithuania | 27.2 /100 | #200 | Fair 1.3% |
| Immigrants | Italy | 25.4 /100 | #201 | Fair 1.3% |
| Arapaho | 24.1 /100 | #202 | Fair 1.3% |
| Liberians | 24.0 /100 | #203 | Fair 1.3% |
| Immigrants | Europe | 23.6 /100 | #204 | Fair 1.3% |
| Romanians | 22.5 /100 | #205 | Fair 1.3% |
| Immigrants | Poland | 22.4 /100 | #206 | Fair 1.3% |
Demographics Similar to British West Indians by Disability Age Under 5
In terms of disability age under 5, the demographic groups most similar to British West Indians are Immigrants from Iran (1.00%, a difference of 0.79%), Yakama (1.00%, a difference of 0.87%), Indian (Asian) (1.0%, a difference of 1.1%), Immigrants from Micronesia (1.0%, a difference of 1.5%), and Immigrants from Taiwan (1.0%, a difference of 1.6%).
| Demographics | Rating | Rank | Disability Age Under 5 |
| Yuman | 100.0 /100 | #14 | Exceptional 0.95% |
| Immigrants | Hong Kong | 100.0 /100 | #15 | Exceptional 0.95% |
| Immigrants | Israel | 100.0 /100 | #16 | Exceptional 0.96% |
| Immigrants | China | 100.0 /100 | #17 | Exceptional 0.96% |
| Immigrants | Barbados | 100.0 /100 | #18 | Exceptional 0.97% |
| Puget Sound Salish | 100.0 /100 | #19 | Exceptional 0.97% |
| Nepalese | 100.0 /100 | #20 | Exceptional 0.97% |
| British West Indians | 100.0 /100 | #21 | Exceptional 0.99% |
| Immigrants | Iran | 100.0 /100 | #22 | Exceptional 1.00% |
| Yakama | 100.0 /100 | #23 | Exceptional 1.00% |
| Indians (Asian) | 100.0 /100 | #24 | Exceptional 1.0% |
| Immigrants | Micronesia | 100.0 /100 | #25 | Exceptional 1.0% |
| Immigrants | Taiwan | 100.0 /100 | #26 | Exceptional 1.0% |
| Guyanese | 100.0 /100 | #27 | Exceptional 1.0% |
| Immigrants | Eastern Asia | 100.0 /100 | #28 | Exceptional 1.0% |